Delta Airlines 2010 Annual Report Download - page 64
Download and view the complete annual report
Please find page 64 of the 2010 Delta Airlines annual report below. You can navigate through the pages in the report by either clicking on the pages listed below, or by using the keyword search tool below to find specific information within the annual report.-
 1
1 -
2
-
3
-
4
-
5
-
6
-
7
-
8
-
9
-
10
-
11
-
12
-
13
-
14
-
15
-
16
-
17
-
18
-
19
-
20
-
21
-
22
-
23
-
24
-
25
-
26
-
27
-
28
-
29
-
30
-
31
-
32
-
33
-
34
-
35
-
36
-
37
-
38
-
39
-
40
-
41
-
42
-
43
-
44
-
45
-
46
-
47
-
48
-
49
-
50
-
51
-
52
-
53
-
 54
54 -
 55
55 -
 56
56 -
 57
57 -
 58
58 -
 59
59 -
 60
60 -
 61
61 -
 62
62 -
 63
63 -
 64
64 -
 65
65 -
 66
66 -
 67
67 -
 68
68 -
 69
69 -
 70
70 -
 71
71 -
 72
72 -
 73
73 -
 74
74 -
75
-
76
-
77
-
78
-
79
-
80
-
81
-
82
-
83
-
84
-
85
-
86
-
87
-
88
-
89
-
90
-
91
-
92
-
93
-
94
-
95
-
96
-
97
-
98
-
99
-
100
-
101
-
102
-
103
-
104
-
105
-
106
-
107
-
108
-
109
-
110
-
111
-
112
-
113
-
114
-
115
-
116
-
117
-
118
-
119
-
120
-
121
-
122
-
123
-
124
-
125
-
126
-
127
-
128
-
129
-
130
-
131
-
132
-
133
-
134
-
135
-
136
-
137
-
138
-
139
-
140
-
141
-
142
-
143
-
144
-
145
-
146
-
147
-
148
-
149
-
150
-
151
-
152
-
153
-
154
-
155
-
156
-
157
-
158
-
159
-
160
-
161
-
162
-
163
-
164
-
165
-
166
-
167
-
168
-
169
-
170
-
171
-
172
-
173
-
174
-
175
-
176
-
177
-
178
-
179
-
180
-
181
-
182
-
183
-
184
-
185
-
186
-
187
-
188
-
189
-
190
-
191
-
192
-
193
-
194
-
195
-
196
-
197
-
198
-
199
-
200
-
201
-
202
-
203
-
204
-
205
-
206
-
207
-
208
-
209
-
210
-
211
-
212
-
213
-
214
-
215
-
216
-
217
-
218
-
219
-
220
-
221
-
222
-
223
-
224
-
225
-
226
-
227
-
228
-
229
-
230
-
231
-
232
-
233
-
234
-
235
-
236
-
237
-
238
-
239
-
240
-
241
-
242
-
243
-
244
-
245
-
246
-
247
-
248
-
249
-
250
-
251
-
252
-
253
-
254
-
255
-
256
-
257
-
258
-
259
-
260
-
261
-
262
-
263
-
264
-
265
-
266
-
267
-
268
-
269
-
270
-
271
-
272
-
273
-
274
-
275
-
276
-
277
-
278
-
279
-
280
-
281
-
282
-
283
-
284
-
285
-
286
-
287
-
288
-
289
-
290
-
291
-
292
-
293
-
294
-
295
-
296
-
297
-
298
-
299
-
300
-
301
-
302
-
303
-
304
-
305
-
306
-
307
-
308
-
309
-
310
-
311
-
312
-
313
-
314
-
315
-
316
-
317
-
318
-
319
-
320
-
321
-
322
-
323
-
324
-
325
-
326
-
327
-
328
-
329
-
330
-
331
-
332
-
333
-
334
-
335
-
336
-
337
-
338
-
339
-
340
-
341
-
342
-
343
-
344
-
345
-
346
-
347
-
348
-
349
-
350
-
351
-
352
-
353
-
354
-
355
-
356
-
357
-
358
-
359
-
360
-
361
-
362
-
363
-
364
-
365
-
366
-
367
-
368
-
369
-
370
-
371
-
372
-
373
-
374
-
375
-
376
-
377
-
378
-
379
-
380
-
381
-
382
-
383
-
384
-
385
-
386
-
387
-
388
-
389
-
390
-
391
-
392
-
393
-
394
-
395
-
396
-
397
-
398
-
399
-
400
-
401
-
402
-
403
-
404
-
405
-
406
-
407
-
408
-
409
-
410
-
411
-
412
-
413
-
414
-
415
-
416
-
417
-
418
-
419
-
420
-
421
-
422
-
423
-
424
-
425
-
426
-
427
-
428
-
429
-
430
-
431
-
432
-
433
-
434
-
435
-
436
-
437
-
438
-
439
-
440
-
441
-
442
-
443
-
444
-
445
-
446
-
447
 |
 |

Table of Contents
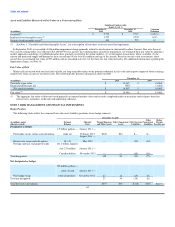
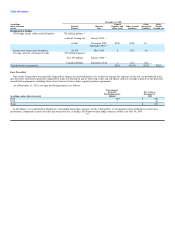
Benefit Plan Assets
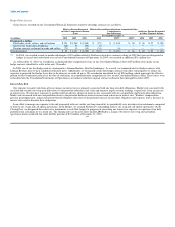
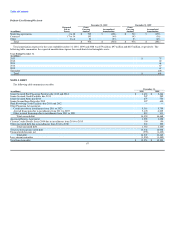
Benefit plan assets relate to our defined benefit pension plans and certain of our postemployment benefit plans that are funded through trusts. The
following table shows our benefit plan assets by asset class. These investments are presented net of the related benefit obligation in pension, postretirement,
and related benefits on our Consolidated Balance Sheets. For additional information regarding benefit plan assets, see Note 10.
December 31, Valuation
(in millions) 2010 Level 1 Level 2 Level 3 Technique
Common stock
U.S. $ 1,427 $ 1,402 $ 25 $ — (a)
Non-U.S. 1,058 1,058 — — (a)
Mutual funds
U.S. 860 1 859 — (a)
Non-U.S. 290 — 290 — (a)
Non-U.S. emerging markets 370 — 370 — (a)
Diversified fixed income 289 — 289 — (a)
High yield 300 — 300 — (a)(c)
Commingled funds
U.S. 917 — 917 — (a)
Non-U.S. 224 — 224 — (a)
Non-U.S. emerging markets 79 — 79 — (a)
Diversified fixed income 405 — 405 — (a)
High yield 53 — 53 — (a)
Alternative investments
Private equity 1,494 — — 1,494 (a)(c)
Real estate and natural resources 396 — — 396 (a)(c)
Fixed income 511 — 511 — (a)(c)
Foreign currency derivative asset 879 — 879 — (a)
Foreign currency derivative liability (874) — (874) — (a)
Cash equivalents and other 681 52 557 72 (a)
Total benefit plan assets $ 9,359 $ 2,513 $ 4,884 $ 1,962
December 31, Valuation
(in millions) 2009 Level 1 Level 2 Level 3 Technique
Common stock
U.S. $ 1,661 $ 1,661 $ — $ — (a)
Non-U.S. 842 842 — — (a)
Mutual funds
U.S. 851 2 849 — (a)
Non-U.S. 251 — 251 — (a)
Non-U.S. emerging markets 335 55 280 — (a)
Diversified fixed income 310 — 310 — (a)
High yield 317 — 271 46 (a)(c)
Commingled funds
U.S. 891 — 891 — (a)
Non-U.S. 187 — 187 — (a)
Non-U.S. emerging markets 86 — 86 — (a)
Diversified fixed income 346 — 346 — (a)
High yield 50 — 50 — (a)
Alternative investments
Private equity 1,216 — — 1,216 (a)(c)
Real estate and natural resources 336 — — 336 (a)(c)
Fixed income 389 — 389 — (a)(c)
Foreign currency derivative asset 833 — 833 — (a)
Foreign currency derivative liability (833) — (833) — (a)
Cash equivalents and other 684 43 606 35 (a)
Total benefit plan assets $ 8,752 $ 2,603 $ 4,516 $ 1,633
60