Delta Airlines 2010 Annual Report Download - page 41
Download and view the complete annual report
Please find page 41 of the 2010 Delta Airlines annual report below. You can navigate through the pages in the report by either clicking on the pages listed below, or by using the keyword search tool below to find specific information within the annual report.-
 1
1 -
2
-
3
-
4
-
5
-
6
-
7
-
8
-
9
-
10
-
11
-
12
-
13
-
14
-
15
-
16
-
17
-
18
-
19
-
20
-
21
-
22
-
23
-
24
-
25
-
26
-
27
-
28
-
29
-
30
-
 31
31 -
 32
32 -
 33
33 -
 34
34 -
 35
35 -
 36
36 -
 37
37 -
 38
38 -
 39
39 -
 40
40 -
 41
41 -
 42
42 -
 43
43 -
 44
44 -
 45
45 -
 46
46 -
 47
47 -
 48
48 -
 49
49 -
 50
50 -
 51
51 -
52
-
53
-
54
-
55
-
56
-
57
-
58
-
59
-
60
-
61
-
62
-
63
-
64
-
65
-
66
-
67
-
68
-
69
-
70
-
71
-
72
-
73
-
74
-
75
-
76
-
77
-
78
-
79
-
80
-
81
-
82
-
83
-
84
-
85
-
86
-
87
-
88
-
89
-
90
-
91
-
92
-
93
-
94
-
95
-
96
-
97
-
98
-
99
-
100
-
101
-
102
-
103
-
104
-
105
-
106
-
107
-
108
-
109
-
110
-
111
-
112
-
113
-
114
-
115
-
116
-
117
-
118
-
119
-
120
-
121
-
122
-
123
-
124
-
125
-
126
-
127
-
128
-
129
-
130
-
131
-
132
-
133
-
134
-
135
-
136
-
137
-
138
-
139
-
140
-
141
-
142
-
143
-
144
-
145
-
146
-
147
-
148
-
149
-
150
-
151
-
152
-
153
-
154
-
155
-
156
-
157
-
158
-
159
-
160
-
161
-
162
-
163
-
164
-
165
-
166
-
167
-
168
-
169
-
170
-
171
-
172
-
173
-
174
-
175
-
176
-
177
-
178
-
179
-
180
-
181
-
182
-
183
-
184
-
185
-
186
-
187
-
188
-
189
-
190
-
191
-
192
-
193
-
194
-
195
-
196
-
197
-
198
-
199
-
200
-
201
-
202
-
203
-
204
-
205
-
206
-
207
-
208
-
209
-
210
-
211
-
212
-
213
-
214
-
215
-
216
-
217
-
218
-
219
-
220
-
221
-
222
-
223
-
224
-
225
-
226
-
227
-
228
-
229
-
230
-
231
-
232
-
233
-
234
-
235
-
236
-
237
-
238
-
239
-
240
-
241
-
242
-
243
-
244
-
245
-
246
-
247
-
248
-
249
-
250
-
251
-
252
-
253
-
254
-
255
-
256
-
257
-
258
-
259
-
260
-
261
-
262
-
263
-
264
-
265
-
266
-
267
-
268
-
269
-
270
-
271
-
272
-
273
-
274
-
275
-
276
-
277
-
278
-
279
-
280
-
281
-
282
-
283
-
284
-
285
-
286
-
287
-
288
-
289
-
290
-
291
-
292
-
293
-
294
-
295
-
296
-
297
-
298
-
299
-
300
-
301
-
302
-
303
-
304
-
305
-
306
-
307
-
308
-
309
-
310
-
311
-
312
-
313
-
314
-
315
-
316
-
317
-
318
-
319
-
320
-
321
-
322
-
323
-
324
-
325
-
326
-
327
-
328
-
329
-
330
-
331
-
332
-
333
-
334
-
335
-
336
-
337
-
338
-
339
-
340
-
341
-
342
-
343
-
344
-
345
-
346
-
347
-
348
-
349
-
350
-
351
-
352
-
353
-
354
-
355
-
356
-
357
-
358
-
359
-
360
-
361
-
362
-
363
-
364
-
365
-
366
-
367
-
368
-
369
-
370
-
371
-
372
-
373
-
374
-
375
-
376
-
377
-
378
-
379
-
380
-
381
-
382
-
383
-
384
-
385
-
386
-
387
-
388
-
389
-
390
-
391
-
392
-
393
-
394
-
395
-
396
-
397
-
398
-
399
-
400
-
401
-
402
-
403
-
404
-
405
-
406
-
407
-
408
-
409
-
410
-
411
-
412
-
413
-
414
-
415
-
416
-
417
-
418
-
419
-
420
-
421
-
422
-
423
-
424
-
425
-
426
-
427
-
428
-
429
-
430
-
431
-
432
-
433
-
434
-
435
-
436
-
437
-
438
-
439
-
440
-
441
-
442
-
443
-
444
-
445
-
446
-
447
 |
 |

Table of Contents
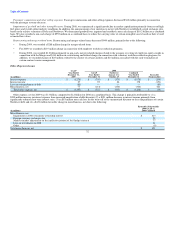
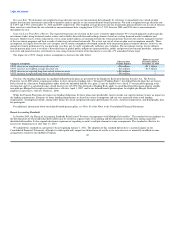
Employee Benefit Obligations. Represents primarily (1) our estimated minimum required funding for our qualified defined benefit pension plans based on
actuarially determined estimates and (2) projected future benefit payments from our unfunded postretirement and postemployment plans. For additional
information about our defined benefit pension plans, see "Critical Accounting Policies and Estimates" and Note 10 of the Notes to the Consolidated Financial
Statements.
Aircraft Purchase Commitments. Represents primarily our commitments to purchase 18 B-787-8 aircraft and 12 previously owned MD-90 aircraft. The
table excludes our orders for five A319-100 aircraft and two A320-200 aircraft because we have the right to cancel these orders. For additional information,
see Note 7 of the Notes to the Consolidated Financial Statements.
Other Obligations. Represents primarily estimated purchase obligations under which we are required to make minimum payments for goods and services,
including but not limited to insurance, outsourced human resource services, marketing, maintenance, technology, sponsorships and other third party services
and products.
Critical Accounting Policies and Estimates
Our critical accounting policies and estimates are those that require significant judgments and estimates. Accordingly, the actual results may differ
materially from these estimates. For a discussion of these and other accounting policies, see Note 1 of our Notes to our Consolidated Financial Statements.
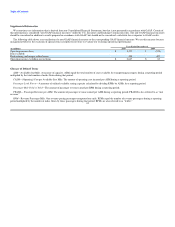
Frequent Flyer Program
Our frequent flyer program (the "SkyMiles Program") offers incentives to increase travel on Delta. This program allows customers to earn mileage credits
by flying on Delta, regional air carriers with which we have contract carrier agreements ("Contract Carriers") and participating airlines, as well as through
participating companies such as credit card companies, hotels and car rental agencies. We also sell mileage credits to non-airline businesses, customers and
other airlines. Mileage credits can be redeemed for air travel on Delta and participating airlines, membership in our Sky Club and other program awards.
We use the residual method for revenue recognition of mileage credits. The fair value of the mileage credit component is determined based on prices at
which we sold mileage credits to other airlines, $0.0054 per mile at December 31, 2010, and is re-evaluated at least annually. Under the residual method, the
portion of the revenue from the sale of mileage credits and the mileage component of passenger ticket sales that approximates fair value is deferred and
recognized as passenger revenue when miles are redeemed and services are provided. The portion of the revenue received in excess of the fair value of
mileage credits sold is recognized in income when the related marketing services are provided and classified as other revenue. For additional information, see
"Recent Accounting Standards."
For mileage credits which we estimate are not likely to be redeemed ("Breakage"), we recognize the associated value proportionally during the period in
which the remaining mileage credits are expected to be redeemed. The estimate of Breakage is based on historical redemption patterns. A change in
assumptions as to the period over which mileage credits are expected to be redeemed, the actual redemption activity for mileage credits or the estimated fair
value of mileage credits expected to be redeemed could have a material impact on our revenue in the year in which the change occurs and in future years. At
December 31, 2010, the aggregate deferred revenue balance associated with the SkyMiles Program was $4.5 billion. A hypothetical 1% change in the number
of outstanding miles estimated to be redeemed would result in a $32 million impact on our deferred revenue liability at December 31, 2010.
Fair Value
Fair value is defined as an exit price, representing the amount that would be received to sell an asset or paid to transfer a liability in an orderly transaction
between market participants. Fair value is a market-based measurement that is determined based on assumptions market participants would use in pricing an
asset or liability. A three-tier fair value hierarchy is used to prioritize the inputs in measuring fair value. Assets and liabilities measured at fair value are based
on one or more of the following valuation techniques: market approach, cost approach and income approach. Accordingly, the actual amounts may differ
materially from the estimates. See Note 2 of the Notes to the Consolidated Financial Statements for additional information.
37