Delta Airlines 2010 Annual Report Download - page 37
Download and view the complete annual report
Please find page 37 of the 2010 Delta Airlines annual report below. You can navigate through the pages in the report by either clicking on the pages listed below, or by using the keyword search tool below to find specific information within the annual report.-
 1
1 -
2
-
3
-
4
-
5
-
6
-
7
-
8
-
9
-
10
-
11
-
12
-
13
-
14
-
15
-
16
-
17
-
18
-
19
-
20
-
21
-
22
-
23
-
24
-
25
-
26
-
 27
27 -
 28
28 -
 29
29 -
 30
30 -
 31
31 -
 32
32 -
 33
33 -
 34
34 -
 35
35 -
 36
36 -
 37
37 -
 38
38 -
 39
39 -
 40
40 -
 41
41 -
 42
42 -
 43
43 -
 44
44 -
 45
45 -
 46
46 -
 47
47 -
48
-
49
-
50
-
51
-
52
-
53
-
54
-
55
-
56
-
57
-
58
-
59
-
60
-
61
-
62
-
63
-
64
-
65
-
66
-
67
-
68
-
69
-
70
-
71
-
72
-
73
-
74
-
75
-
76
-
77
-
78
-
79
-
80
-
81
-
82
-
83
-
84
-
85
-
86
-
87
-
88
-
89
-
90
-
91
-
92
-
93
-
94
-
95
-
96
-
97
-
98
-
99
-
100
-
101
-
102
-
103
-
104
-
105
-
106
-
107
-
108
-
109
-
110
-
111
-
112
-
113
-
114
-
115
-
116
-
117
-
118
-
119
-
120
-
121
-
122
-
123
-
124
-
125
-
126
-
127
-
128
-
129
-
130
-
131
-
132
-
133
-
134
-
135
-
136
-
137
-
138
-
139
-
140
-
141
-
142
-
143
-
144
-
145
-
146
-
147
-
148
-
149
-
150
-
151
-
152
-
153
-
154
-
155
-
156
-
157
-
158
-
159
-
160
-
161
-
162
-
163
-
164
-
165
-
166
-
167
-
168
-
169
-
170
-
171
-
172
-
173
-
174
-
175
-
176
-
177
-
178
-
179
-
180
-
181
-
182
-
183
-
184
-
185
-
186
-
187
-
188
-
189
-
190
-
191
-
192
-
193
-
194
-
195
-
196
-
197
-
198
-
199
-
200
-
201
-
202
-
203
-
204
-
205
-
206
-
207
-
208
-
209
-
210
-
211
-
212
-
213
-
214
-
215
-
216
-
217
-
218
-
219
-
220
-
221
-
222
-
223
-
224
-
225
-
226
-
227
-
228
-
229
-
230
-
231
-
232
-
233
-
234
-
235
-
236
-
237
-
238
-
239
-
240
-
241
-
242
-
243
-
244
-
245
-
246
-
247
-
248
-
249
-
250
-
251
-
252
-
253
-
254
-
255
-
256
-
257
-
258
-
259
-
260
-
261
-
262
-
263
-
264
-
265
-
266
-
267
-
268
-
269
-
270
-
271
-
272
-
273
-
274
-
275
-
276
-
277
-
278
-
279
-
280
-
281
-
282
-
283
-
284
-
285
-
286
-
287
-
288
-
289
-
290
-
291
-
292
-
293
-
294
-
295
-
296
-
297
-
298
-
299
-
300
-
301
-
302
-
303
-
304
-
305
-
306
-
307
-
308
-
309
-
310
-
311
-
312
-
313
-
314
-
315
-
316
-
317
-
318
-
319
-
320
-
321
-
322
-
323
-
324
-
325
-
326
-
327
-
328
-
329
-
330
-
331
-
332
-
333
-
334
-
335
-
336
-
337
-
338
-
339
-
340
-
341
-
342
-
343
-
344
-
345
-
346
-
347
-
348
-
349
-
350
-
351
-
352
-
353
-
354
-
355
-
356
-
357
-
358
-
359
-
360
-
361
-
362
-
363
-
364
-
365
-
366
-
367
-
368
-
369
-
370
-
371
-
372
-
373
-
374
-
375
-
376
-
377
-
378
-
379
-
380
-
381
-
382
-
383
-
384
-
385
-
386
-
387
-
388
-
389
-
390
-
391
-
392
-
393
-
394
-
395
-
396
-
397
-
398
-
399
-
400
-
401
-
402
-
403
-
404
-
405
-
406
-
407
-
408
-
409
-
410
-
411
-
412
-
413
-
414
-
415
-
416
-
417
-
418
-
419
-
420
-
421
-
422
-
423
-
424
-
425
-
426
-
427
-
428
-
429
-
430
-
431
-
432
-
433
-
434
-
435
-
436
-
437
-
438
-
439
-
440
-
441
-
442
-
443
-
444
-
445
-
446
-
447
 |
 |

Table of Contents
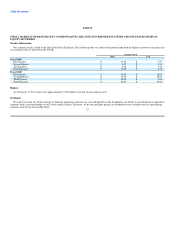
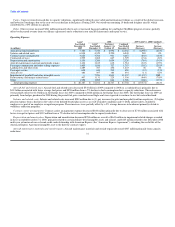
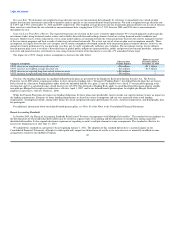
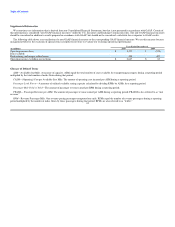
Income Taxes
2008
GAAP
Year Ended GAAP Northwest Combined
December 31, Year Ended January 1 to Year Ended
(in millions) 2009 December 31 October 29 December 31 Increase
Income tax benefit $ 344 $ 119 $ 211 $ 330 $ 14
We consider all income sources, including other comprehensive income, in determining the amount of tax benefit allocated to continuing operations. For
2009, we recorded an income tax benefit of $344 million, including a non-cash income tax benefit of $321 million on the loss from continuing operations,
with an offsetting non-cash income tax expense of $321 million on other comprehensive income. We did not record an income tax benefit for U.S. federal
income tax purposes in 2009 since our deferred tax assets are fully reserved by a valuation allowance.
We recorded an income tax benefit of $330 million for 2008 on a combined basis due to the impairment of our indefinite-lived intangible assets. The
impairment of goodwill did not result in an income tax benefit because goodwill is not deductible for income tax purposes. We did not record an income tax
benefit for U.S. federal income tax purposes as a result of the remaining loss for 2008. The deferred tax asset resulting from such a net operating loss is fully
reserved by a valuation allowance.
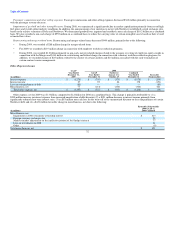
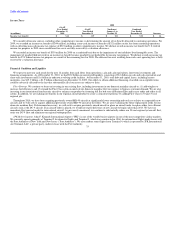
Financial Condition and Liquidity
We expect to meet our cash needs for the next 12 months from cash flows from operations, cash and cash equivalents, short-term investments and
financing arrangements. As of December 31, 2010, we had $5.2 billion in unrestricted liquidity, consisting of $3.6 billion in cash and cash equivalents and
short-term investments and $1.6 billion in undrawn revolving credit facilities. At December 31, 2010, total debt and capital leases, including current
maturities, was $15.3 billion, a $1.9 billion reduction from December 31, 2009. Our ability to obtain additional financing, if needed, on acceptable terms
could be adversely affected by the fact that substantially all of our assets are subject to liens.
Fleet Strategy. We continue to focus on investing in our existing fleet, including investments in our domestic mainline aircraft to: (1) add winglets to
increase fuel efficiency and (2) expand the First Class cabin on much of our domestic mainline fleet in response to business customer demand. We are also
investing in our international transoceanic aircraft to enhance our product by featuring full flat bed seats in BusinessElite and in-seat audio and video in all
cabins. In addition, we are making investments in our regional aircraft product to create a consistent experience by adding First Class to 70 and 76 seat
regional jets.
Throughout 2010, we have been acquiring previously owned MD-90 aircraft at significantly lower ownership and total cost relative to comparable new
aircraft, and we will seek to acquire additional previously owned MD-90 aircraft in the future. We are also evaluating the future replacement needs for our
domestic mainline fleet. If determined necessary, we will seek to acquire previously owned aircraft or place an aircraft order to replace older, less efficient
aircraft, such as the DC-9 aircraft. If an aircraft order is placed, we would not expect deliveries of new aircraft to begin earlier than 2013. We have no
immediate fleet renewal needs for international aircraft. As previously announced, we continue to substantially reduce our 50-seat regional jet aircraft fleet,
retire our DC-9 fleet and eliminate our regional turboprop fleet.
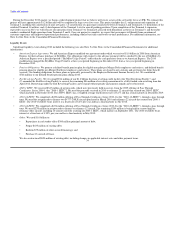
JFK Redevelopment. John F. Kennedy International Airport ("JFK") is one of the world's busiest airports in one of the most competitive airline markets.
We currently operate primarily at Terminal 2 for domestic flights and Terminal 3, which was constructed in 1960, for international flights under leases with
the Port Authority of New York and New Jersey ("Port Authority"). We also conduct some flights from Terminal 4, which is operated by JFK International
Air Terminal, LLC, a private party, under its lease with the Port Authority.
33