Delta Airlines 2010 Annual Report Download - page 79
Download and view the complete annual report
Please find page 79 of the 2010 Delta Airlines annual report below. You can navigate through the pages in the report by either clicking on the pages listed below, or by using the keyword search tool below to find specific information within the annual report.-
 1
1 -
2
-
3
-
4
-
5
-
6
-
7
-
8
-
9
-
10
-
11
-
12
-
13
-
14
-
15
-
16
-
17
-
18
-
19
-
20
-
21
-
22
-
23
-
24
-
25
-
26
-
27
-
28
-
29
-
30
-
31
-
32
-
33
-
34
-
35
-
36
-
37
-
38
-
39
-
40
-
41
-
42
-
43
-
44
-
45
-
46
-
47
-
48
-
49
-
50
-
51
-
52
-
53
-
54
-
55
-
56
-
57
-
58
-
59
-
60
-
61
-
62
-
63
-
64
-
65
-
66
-
67
-
68
-
 69
69 -
 70
70 -
 71
71 -
 72
72 -
 73
73 -
 74
74 -
 75
75 -
 76
76 -
 77
77 -
 78
78 -
 79
79 -
 80
80 -
 81
81 -
 82
82 -
 83
83 -
 84
84 -
 85
85 -
 86
86 -
 87
87 -
 88
88 -
 89
89 -
90
-
91
-
92
-
93
-
94
-
95
-
96
-
97
-
98
-
99
-
100
-
101
-
102
-
103
-
104
-
105
-
106
-
107
-
108
-
109
-
110
-
111
-
112
-
113
-
114
-
115
-
116
-
117
-
118
-
119
-
120
-
121
-
122
-
123
-
124
-
125
-
126
-
127
-
128
-
129
-
130
-
131
-
132
-
133
-
134
-
135
-
136
-
137
-
138
-
139
-
140
-
141
-
142
-
143
-
144
-
145
-
146
-
147
-
148
-
149
-
150
-
151
-
152
-
153
-
154
-
155
-
156
-
157
-
158
-
159
-
160
-
161
-
162
-
163
-
164
-
165
-
166
-
167
-
168
-
169
-
170
-
171
-
172
-
173
-
174
-
175
-
176
-
177
-
178
-
179
-
180
-
181
-
182
-
183
-
184
-
185
-
186
-
187
-
188
-
189
-
190
-
191
-
192
-
193
-
194
-
195
-
196
-
197
-
198
-
199
-
200
-
201
-
202
-
203
-
204
-
205
-
206
-
207
-
208
-
209
-
210
-
211
-
212
-
213
-
214
-
215
-
216
-
217
-
218
-
219
-
220
-
221
-
222
-
223
-
224
-
225
-
226
-
227
-
228
-
229
-
230
-
231
-
232
-
233
-
234
-
235
-
236
-
237
-
238
-
239
-
240
-
241
-
242
-
243
-
244
-
245
-
246
-
247
-
248
-
249
-
250
-
251
-
252
-
253
-
254
-
255
-
256
-
257
-
258
-
259
-
260
-
261
-
262
-
263
-
264
-
265
-
266
-
267
-
268
-
269
-
270
-
271
-
272
-
273
-
274
-
275
-
276
-
277
-
278
-
279
-
280
-
281
-
282
-
283
-
284
-
285
-
286
-
287
-
288
-
289
-
290
-
291
-
292
-
293
-
294
-
295
-
296
-
297
-
298
-
299
-
300
-
301
-
302
-
303
-
304
-
305
-
306
-
307
-
308
-
309
-
310
-
311
-
312
-
313
-
314
-
315
-
316
-
317
-
318
-
319
-
320
-
321
-
322
-
323
-
324
-
325
-
326
-
327
-
328
-
329
-
330
-
331
-
332
-
333
-
334
-
335
-
336
-
337
-
338
-
339
-
340
-
341
-
342
-
343
-
344
-
345
-
346
-
347
-
348
-
349
-
350
-
351
-
352
-
353
-
354
-
355
-
356
-
357
-
358
-
359
-
360
-
361
-
362
-
363
-
364
-
365
-
366
-
367
-
368
-
369
-
370
-
371
-
372
-
373
-
374
-
375
-
376
-
377
-
378
-
379
-
380
-
381
-
382
-
383
-
384
-
385
-
386
-
387
-
388
-
389
-
390
-
391
-
392
-
393
-
394
-
395
-
396
-
397
-
398
-
399
-
400
-
401
-
402
-
403
-
404
-
405
-
406
-
407
-
408
-
409
-
410
-
411
-
412
-
413
-
414
-
415
-
416
-
417
-
418
-
419
-
420
-
421
-
422
-
423
-
424
-
425
-
426
-
427
-
428
-
429
-
430
-
431
-
432
-
433
-
434
-
435
-
436
-
437
-
438
-
439
-
440
-
441
-
442
-
443
-
444
-
445
-
446
-
447
 |
 |
Table of Contents
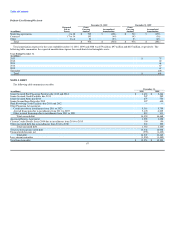
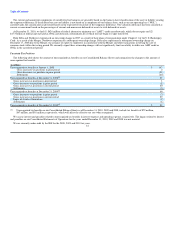
The following table shows our minimum fixed obligations under these capacity purchase agreements (excluding Comair). The obligations set forth in the
table contemplate minimum levels of flying by the Contract Carriers under the respective agreements and also reflect assumptions regarding certain costs
associated with the minimum levels of flying such as the cost of fuel, labor, maintenance, insurance, catering, property tax and landing fees. Accordingly, our
actual payments under these agreements could differ materially from the minimum fixed obligations set forth in the table below.
Year Ending December 31,
(in millions) Amount(1)
2011 $ 2,080
2012 1,970
2013 2,040
2014 2,050
2015 2,020
Thereafter 6,740
Total $ 16,900
(1) These amounts exclude Contract Carrier lease payments accounted for as operating leases, which are described in Note 6. The contingencies described
below under "Contingencies Related to Termination of Contract Carrier Agreements" are also excluded from this table.
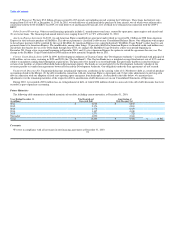
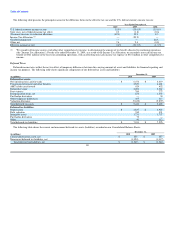
The following table shows information about our third-party Contract Carrier agreements as of December 31, 2010:
Number of Number of Aircraft
Aircraft in Number of Aircraft Scheduled to be in
Operation as of Scheduled to be in Operation Immediately
December 31, Operation as of Prior to the Expiration Expiration Date
Carrier 2010 December 31, 2011 of the Agreement of Agreement
ASA 142 146 26 2020
SkyWest Airlines 82 87 37 2020
ASA/SkyWest Airlines(1) 12 12 12 2012
Chautauqua 24 24 24 2016
Shuttle America 16 16 16 2019
Pinnacle (CRJ-900 aircraft) 16 16 1 2018
Pinnacle/Mesaba (CRJ-200 aircraft)(2) 145 145 141 2017
Pinnacle/Mesaba (CRJ-900 aircraft)(2) 41 41 41 2022
Compass 36 36 36 2020
Mesaba (Saab 340B+ aircraft) 26 — — 2012
Total 540 523 334
The table above was not subject to the audit procedures of our Independent Registered Public Accounting Firm.
(1) We have an agreement with ASA, SkyWest Airlines and SkyWest, Inc. ("SkyWest"), the parent company of ASA and SkyWest Airlines, under which
the parties collectively determine whether the aircraft are operated by ASA or SkyWest Airlines.
(2) We have an agreement with Mesaba Airlines, Pinnacle Airlines and Pinnacle Airlines Corp., the parent company of Mesaba Airlines and Pinnacle
Airlines, under which the parties collectively determine whether the aircraft are operated by Mesaba Airlines or Pinnacle Airlines.
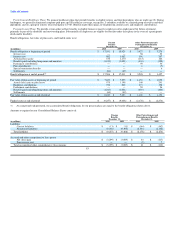
The following table shows the available seat miles ("ASMs") and revenue passenger miles ("RPMs") operated for us under capacity purchase agreements
with our Contract Carriers. It excludes Comair for all years presented, and also excludes Compass and Mesaba for the years ended December 31, 2009 and
2008:
(in millions, except for number of aircraft operated) 2010 2009 2008
ASMs 27,228 20,852 17,425
RPMs 21,512 16,424 13,899
Number of aircraft operated, end of period 540 450 443
The table above was not subject to the audit procedures of our Independent Registered Public Accounting Firm.
75