Delta Airlines 2010 Annual Report Download - page 66
Download and view the complete annual report
Please find page 66 of the 2010 Delta Airlines annual report below. You can navigate through the pages in the report by either clicking on the pages listed below, or by using the keyword search tool below to find specific information within the annual report.-
 1
1 -
2
-
3
-
4
-
5
-
6
-
7
-
8
-
9
-
10
-
11
-
12
-
13
-
14
-
15
-
16
-
17
-
18
-
19
-
20
-
21
-
22
-
23
-
24
-
25
-
26
-
27
-
28
-
29
-
30
-
31
-
32
-
33
-
34
-
35
-
36
-
37
-
38
-
39
-
40
-
41
-
42
-
43
-
44
-
45
-
46
-
47
-
48
-
49
-
50
-
51
-
52
-
53
-
54
-
55
-
 56
56 -
 57
57 -
 58
58 -
 59
59 -
 60
60 -
 61
61 -
 62
62 -
 63
63 -
 64
64 -
 65
65 -
 66
66 -
 67
67 -
 68
68 -
 69
69 -
 70
70 -
 71
71 -
 72
72 -
 73
73 -
 74
74 -
 75
75 -
 76
76 -
77
-
78
-
79
-
80
-
81
-
82
-
83
-
84
-
85
-
86
-
87
-
88
-
89
-
90
-
91
-
92
-
93
-
94
-
95
-
96
-
97
-
98
-
99
-
100
-
101
-
102
-
103
-
104
-
105
-
106
-
107
-
108
-
109
-
110
-
111
-
112
-
113
-
114
-
115
-
116
-
117
-
118
-
119
-
120
-
121
-
122
-
123
-
124
-
125
-
126
-
127
-
128
-
129
-
130
-
131
-
132
-
133
-
134
-
135
-
136
-
137
-
138
-
139
-
140
-
141
-
142
-
143
-
144
-
145
-
146
-
147
-
148
-
149
-
150
-
151
-
152
-
153
-
154
-
155
-
156
-
157
-
158
-
159
-
160
-
161
-
162
-
163
-
164
-
165
-
166
-
167
-
168
-
169
-
170
-
171
-
172
-
173
-
174
-
175
-
176
-
177
-
178
-
179
-
180
-
181
-
182
-
183
-
184
-
185
-
186
-
187
-
188
-
189
-
190
-
191
-
192
-
193
-
194
-
195
-
196
-
197
-
198
-
199
-
200
-
201
-
202
-
203
-
204
-
205
-
206
-
207
-
208
-
209
-
210
-
211
-
212
-
213
-
214
-
215
-
216
-
217
-
218
-
219
-
220
-
221
-
222
-
223
-
224
-
225
-
226
-
227
-
228
-
229
-
230
-
231
-
232
-
233
-
234
-
235
-
236
-
237
-
238
-
239
-
240
-
241
-
242
-
243
-
244
-
245
-
246
-
247
-
248
-
249
-
250
-
251
-
252
-
253
-
254
-
255
-
256
-
257
-
258
-
259
-
260
-
261
-
262
-
263
-
264
-
265
-
266
-
267
-
268
-
269
-
270
-
271
-
272
-
273
-
274
-
275
-
276
-
277
-
278
-
279
-
280
-
281
-
282
-
283
-
284
-
285
-
286
-
287
-
288
-
289
-
290
-
291
-
292
-
293
-
294
-
295
-
296
-
297
-
298
-
299
-
300
-
301
-
302
-
303
-
304
-
305
-
306
-
307
-
308
-
309
-
310
-
311
-
312
-
313
-
314
-
315
-
316
-
317
-
318
-
319
-
320
-
321
-
322
-
323
-
324
-
325
-
326
-
327
-
328
-
329
-
330
-
331
-
332
-
333
-
334
-
335
-
336
-
337
-
338
-
339
-
340
-
341
-
342
-
343
-
344
-
345
-
346
-
347
-
348
-
349
-
350
-
351
-
352
-
353
-
354
-
355
-
356
-
357
-
358
-
359
-
360
-
361
-
362
-
363
-
364
-
365
-
366
-
367
-
368
-
369
-
370
-
371
-
372
-
373
-
374
-
375
-
376
-
377
-
378
-
379
-
380
-
381
-
382
-
383
-
384
-
385
-
386
-
387
-
388
-
389
-
390
-
391
-
392
-
393
-
394
-
395
-
396
-
397
-
398
-
399
-
400
-
401
-
402
-
403
-
404
-
405
-
406
-
407
-
408
-
409
-
410
-
411
-
412
-
413
-
414
-
415
-
416
-
417
-
418
-
419
-
420
-
421
-
422
-
423
-
424
-
425
-
426
-
427
-
428
-
429
-
430
-
431
-
432
-
433
-
434
-
435
-
436
-
437
-
438
-
439
-
440
-
441
-
442
-
443
-
444
-
445
-
446
-
447
 |
 |

Table of Contents
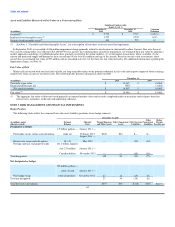
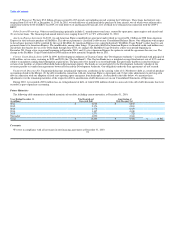
Assets and Liabilities Measured at Fair Value on a Nonrecurring Basis
Significant Unobservable
Inputs (Level 3)
December 31, December 31, Valuation
(in millions) 2010 2009 Technique
Goodwill(1) $ 9,794 $ 9,787 (a)(b)(c)
Indefinite-lived intangible assets(1) 4,303 4,304 (a)(c)
Definite-lived intangible assets(1) 446 525 (c)
(1) See Note 1, "Goodwill and Other Intangible Assets", for a description of how these assets are tested for impairment.
In September 2010, we recorded a $146 million impairment charge primarily related to our decision to substantially reduce Comair's fleet over the next
two years by retiring older, less-efficient CRJ-100/200 50-seat aircraft. In evaluating these aircraft for impairment, we estimated their fair value by utilizing a
market approach considering (1) published market data generally accepted in the airline industry, (2) recent market transactions, where available, (3) the
current and projected supply and demand of these aircraft and (4) the overall condition and age of the aircraft. Based on our fair value assessments, these
aircraft have an estimated fair value of $97 million and are classified in Level 3 of the three-tier fair value hierarchy. For additional information regarding this
impairment charge, see Note 16.
Fair Value of Debt
Market risk associated with our fixed and variable rate long-term debt relates to the potential reduction in fair value and negative impact to future earnings,
respectively, from an increase in interest rates. The following table presents information about our debt:
December 31,
(in millions) 2010 2009
Total debt at par value $ 15,442 $ 18,068
Unamortized discount, net (935) (1,403)
Net carrying amount $ 14,507 $ 16,665
Fair value(1) $ 15,400 $ 15,400
(1) The aggregate fair value of debt was based primarily on reported market values and recently completed market transactions and estimates based on
interest rates, maturities, credit risk and underlying collateral.
NOTE 3. RISK MANAGEMENT AND FINANCIAL INSTRUMENTS
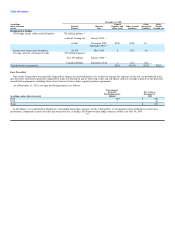
Hedge Position
The following tables reflect the estimated fair value asset (liability) positions of our hedge contracts:
December 31, 2010
Other Hedge
(in millions, unless Notional Maturity Prepaid Expenses Other Noncurrent Other Accrued Noncurrent Margin
otherwise stated) Balance Date and Other Assets Assets Liabilities Liabilities Payable, net
Designated as hedges
Fuel hedge swaps, collars and call options
1.5 billion gallons —
crude oil
January 2011 —
February 2012 $328 $24 $— $—
Interest rate swaps and call options $1,143
August 2011 —
May 2019 — — (35) (39)
Foreign currency exchange forwards
141.1 billion Japanese
yen; 233 million
Canadian dollars
January 2011 —
November 2013 — — (60) (36)
Total designated 328 24 (95) (75)
Not designated as hedges
Fuel hedge swaps
192 million gallons —
crude oil and
crude oil products
January 2011 —
December 2011 27 14 (19) (8)
Total not designated 27 14 (19) (8)
Total derivative instruments $355 $38 $(114) $(83) $(119)
62