Delta Airlines 2010 Annual Report Download - page 70
Download and view the complete annual report
Please find page 70 of the 2010 Delta Airlines annual report below. You can navigate through the pages in the report by either clicking on the pages listed below, or by using the keyword search tool below to find specific information within the annual report.-
 1
1 -
2
-
3
-
4
-
5
-
6
-
7
-
8
-
9
-
10
-
11
-
12
-
13
-
14
-
15
-
16
-
17
-
18
-
19
-
20
-
21
-
22
-
23
-
24
-
25
-
26
-
27
-
28
-
29
-
30
-
31
-
32
-
33
-
34
-
35
-
36
-
37
-
38
-
39
-
40
-
41
-
42
-
43
-
44
-
45
-
46
-
47
-
48
-
49
-
50
-
51
-
52
-
53
-
54
-
55
-
56
-
57
-
58
-
59
-
 60
60 -
 61
61 -
 62
62 -
 63
63 -
 64
64 -
 65
65 -
 66
66 -
 67
67 -
 68
68 -
 69
69 -
 70
70 -
 71
71 -
 72
72 -
 73
73 -
 74
74 -
 75
75 -
 76
76 -
 77
77 -
 78
78 -
 79
79 -
 80
80 -
81
-
82
-
83
-
84
-
85
-
86
-
87
-
88
-
89
-
90
-
91
-
92
-
93
-
94
-
95
-
96
-
97
-
98
-
99
-
100
-
101
-
102
-
103
-
104
-
105
-
106
-
107
-
108
-
109
-
110
-
111
-
112
-
113
-
114
-
115
-
116
-
117
-
118
-
119
-
120
-
121
-
122
-
123
-
124
-
125
-
126
-
127
-
128
-
129
-
130
-
131
-
132
-
133
-
134
-
135
-
136
-
137
-
138
-
139
-
140
-
141
-
142
-
143
-
144
-
145
-
146
-
147
-
148
-
149
-
150
-
151
-
152
-
153
-
154
-
155
-
156
-
157
-
158
-
159
-
160
-
161
-
162
-
163
-
164
-
165
-
166
-
167
-
168
-
169
-
170
-
171
-
172
-
173
-
174
-
175
-
176
-
177
-
178
-
179
-
180
-
181
-
182
-
183
-
184
-
185
-
186
-
187
-
188
-
189
-
190
-
191
-
192
-
193
-
194
-
195
-
196
-
197
-
198
-
199
-
200
-
201
-
202
-
203
-
204
-
205
-
206
-
207
-
208
-
209
-
210
-
211
-
212
-
213
-
214
-
215
-
216
-
217
-
218
-
219
-
220
-
221
-
222
-
223
-
224
-
225
-
226
-
227
-
228
-
229
-
230
-
231
-
232
-
233
-
234
-
235
-
236
-
237
-
238
-
239
-
240
-
241
-
242
-
243
-
244
-
245
-
246
-
247
-
248
-
249
-
250
-
251
-
252
-
253
-
254
-
255
-
256
-
257
-
258
-
259
-
260
-
261
-
262
-
263
-
264
-
265
-
266
-
267
-
268
-
269
-
270
-
271
-
272
-
273
-
274
-
275
-
276
-
277
-
278
-
279
-
280
-
281
-
282
-
283
-
284
-
285
-
286
-
287
-
288
-
289
-
290
-
291
-
292
-
293
-
294
-
295
-
296
-
297
-
298
-
299
-
300
-
301
-
302
-
303
-
304
-
305
-
306
-
307
-
308
-
309
-
310
-
311
-
312
-
313
-
314
-
315
-
316
-
317
-
318
-
319
-
320
-
321
-
322
-
323
-
324
-
325
-
326
-
327
-
328
-
329
-
330
-
331
-
332
-
333
-
334
-
335
-
336
-
337
-
338
-
339
-
340
-
341
-
342
-
343
-
344
-
345
-
346
-
347
-
348
-
349
-
350
-
351
-
352
-
353
-
354
-
355
-
356
-
357
-
358
-
359
-
360
-
361
-
362
-
363
-
364
-
365
-
366
-
367
-
368
-
369
-
370
-
371
-
372
-
373
-
374
-
375
-
376
-
377
-
378
-
379
-
380
-
381
-
382
-
383
-
384
-
385
-
386
-
387
-
388
-
389
-
390
-
391
-
392
-
393
-
394
-
395
-
396
-
397
-
398
-
399
-
400
-
401
-
402
-
403
-
404
-
405
-
406
-
407
-
408
-
409
-
410
-
411
-
412
-
413
-
414
-
415
-
416
-
417
-
418
-
419
-
420
-
421
-
422
-
423
-
424
-
425
-
426
-
427
-
428
-
429
-
430
-
431
-
432
-
433
-
434
-
435
-
436
-
437
-
438
-
439
-
440
-
441
-
442
-
443
-
444
-
445
-
446
-
447
 |
 |

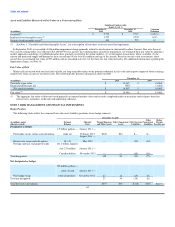
Table of Contents
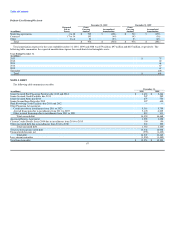
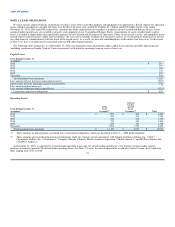
NOTE 4. GOODWILL AND OTHER INTANGIBLE ASSETS
The following table reflects the changes in the carrying amount of goodwill:
Gross Carrying
(in millions) Amount Impairment Net
Balance at January 1, 2009 $ 16,670 $ (6,939) $ 9,731
Northwest Merger 60 — 60
Other (4) — (4)
Balance at December 31, 2009 16,726 (6,939) 9,787
Other 7 — 7
Balance at December 31, 2010 $ 16,733 $ (6,939) $ 9,794
During 2008, we experienced a significant decline in market capitalization primarily from record high fuel prices and overall airline industry conditions. In
addition, the announcement of our intention to merge with Northwest established a stock exchange ratio based on the relative valuation of Delta and
Northwest (see Note 12). We determined that these factors combined with further increases in fuel prices were an indicator that a goodwill impairment test
was required. As a result, we estimated fair value based on a discounted projection of future cash flows, supported with a market-based valuation. We
determined that goodwill was impaired and recorded a non-cash charge of $6.9 billion for the year ended December 31, 2008.
We also recorded a non-cash charge of $357 million ($238 million after tax) for the year ended December 31, 2008 to reduce the carrying value of certain
intangible assets based on their revised estimated fair values. This charge was included in impairment of goodwill and other intangible assets on our
Consolidated Statement of Operations for the year ended December 31, 2008.
The following tables reflect the carrying amount of intangible assets:
Indefinite-Lived Intangible Assets
Carrying Carrying
Amount Amount
December 31, December 31,
(in millions) 2010 2009
International routes and slots $ 2,290 $ 2,290
Delta tradename 850 850
SkyTeam alliance 661 661
Domestic routes and slots 500 500
Other 2 3
Total $ 4,303 $ 4,304
International Routes and Slots. In October 2010, the U.S. and Japan signed an open skies agreement ("Japan Open Skies"), which allows U.S. air carriers
unlimited flying to and from Japan under route authorities granted by the U.S. Department of Transportation. Access to the primary Japanese airports (Haneda
and Narita airports in Tokyo) continues to be regulated through allocations of take-off and landing authorizations or "slots," which limit the rights of carriers
to operate at these airports. The U.S. and Japan have agreed on plans for a limited number of additional slots at these airports. The substantial number of slots
we hold at Tokyo Narita Airport, combined with limited-entry rights we hold in other countries, enables us to operate a hub at Tokyo serving the Asia-Pacific
region. We currently believe that Japan Open Skies will not have a significant long-term impact on our Pacific routes and slots; therefore, these assets
continue to have an indefinite life and are not presently impaired. Negative changes to our operations could result in an impairment charge or a change from
indefinite-lived to definite-lived in the period in which the changes occur or are projected to occur.
66