Delta Airlines 2010 Annual Report Download - page 29
Download and view the complete annual report
Please find page 29 of the 2010 Delta Airlines annual report below. You can navigate through the pages in the report by either clicking on the pages listed below, or by using the keyword search tool below to find specific information within the annual report.-
 1
1 -
2
-
3
-
4
-
5
-
6
-
7
-
8
-
9
-
10
-
11
-
12
-
13
-
14
-
15
-
16
-
17
-
18
-
 19
19 -
 20
20 -
 21
21 -
 22
22 -
 23
23 -
 24
24 -
 25
25 -
 26
26 -
 27
27 -
 28
28 -
 29
29 -
 30
30 -
 31
31 -
 32
32 -
 33
33 -
 34
34 -
 35
35 -
 36
36 -
 37
37 -
 38
38 -
 39
39 -
40
-
41
-
42
-
43
-
44
-
45
-
46
-
47
-
48
-
49
-
50
-
51
-
52
-
53
-
54
-
55
-
56
-
57
-
58
-
59
-
60
-
61
-
62
-
63
-
64
-
65
-
66
-
67
-
68
-
69
-
70
-
71
-
72
-
73
-
74
-
75
-
76
-
77
-
78
-
79
-
80
-
81
-
82
-
83
-
84
-
85
-
86
-
87
-
88
-
89
-
90
-
91
-
92
-
93
-
94
-
95
-
96
-
97
-
98
-
99
-
100
-
101
-
102
-
103
-
104
-
105
-
106
-
107
-
108
-
109
-
110
-
111
-
112
-
113
-
114
-
115
-
116
-
117
-
118
-
119
-
120
-
121
-
122
-
123
-
124
-
125
-
126
-
127
-
128
-
129
-
130
-
131
-
132
-
133
-
134
-
135
-
136
-
137
-
138
-
139
-
140
-
141
-
142
-
143
-
144
-
145
-
146
-
147
-
148
-
149
-
150
-
151
-
152
-
153
-
154
-
155
-
156
-
157
-
158
-
159
-
160
-
161
-
162
-
163
-
164
-
165
-
166
-
167
-
168
-
169
-
170
-
171
-
172
-
173
-
174
-
175
-
176
-
177
-
178
-
179
-
180
-
181
-
182
-
183
-
184
-
185
-
186
-
187
-
188
-
189
-
190
-
191
-
192
-
193
-
194
-
195
-
196
-
197
-
198
-
199
-
200
-
201
-
202
-
203
-
204
-
205
-
206
-
207
-
208
-
209
-
210
-
211
-
212
-
213
-
214
-
215
-
216
-
217
-
218
-
219
-
220
-
221
-
222
-
223
-
224
-
225
-
226
-
227
-
228
-
229
-
230
-
231
-
232
-
233
-
234
-
235
-
236
-
237
-
238
-
239
-
240
-
241
-
242
-
243
-
244
-
245
-
246
-
247
-
248
-
249
-
250
-
251
-
252
-
253
-
254
-
255
-
256
-
257
-
258
-
259
-
260
-
261
-
262
-
263
-
264
-
265
-
266
-
267
-
268
-
269
-
270
-
271
-
272
-
273
-
274
-
275
-
276
-
277
-
278
-
279
-
280
-
281
-
282
-
283
-
284
-
285
-
286
-
287
-
288
-
289
-
290
-
291
-
292
-
293
-
294
-
295
-
296
-
297
-
298
-
299
-
300
-
301
-
302
-
303
-
304
-
305
-
306
-
307
-
308
-
309
-
310
-
311
-
312
-
313
-
314
-
315
-
316
-
317
-
318
-
319
-
320
-
321
-
322
-
323
-
324
-
325
-
326
-
327
-
328
-
329
-
330
-
331
-
332
-
333
-
334
-
335
-
336
-
337
-
338
-
339
-
340
-
341
-
342
-
343
-
344
-
345
-
346
-
347
-
348
-
349
-
350
-
351
-
352
-
353
-
354
-
355
-
356
-
357
-
358
-
359
-
360
-
361
-
362
-
363
-
364
-
365
-
366
-
367
-
368
-
369
-
370
-
371
-
372
-
373
-
374
-
375
-
376
-
377
-
378
-
379
-
380
-
381
-
382
-
383
-
384
-
385
-
386
-
387
-
388
-
389
-
390
-
391
-
392
-
393
-
394
-
395
-
396
-
397
-
398
-
399
-
400
-
401
-
402
-
403
-
404
-
405
-
406
-
407
-
408
-
409
-
410
-
411
-
412
-
413
-
414
-
415
-
416
-
417
-
418
-
419
-
420
-
421
-
422
-
423
-
424
-
425
-
426
-
427
-
428
-
429
-
430
-
431
-
432
-
433
-
434
-
435
-
436
-
437
-
438
-
439
-
440
-
441
-
442
-
443
-
444
-
445
-
446
-
447
 |
 |
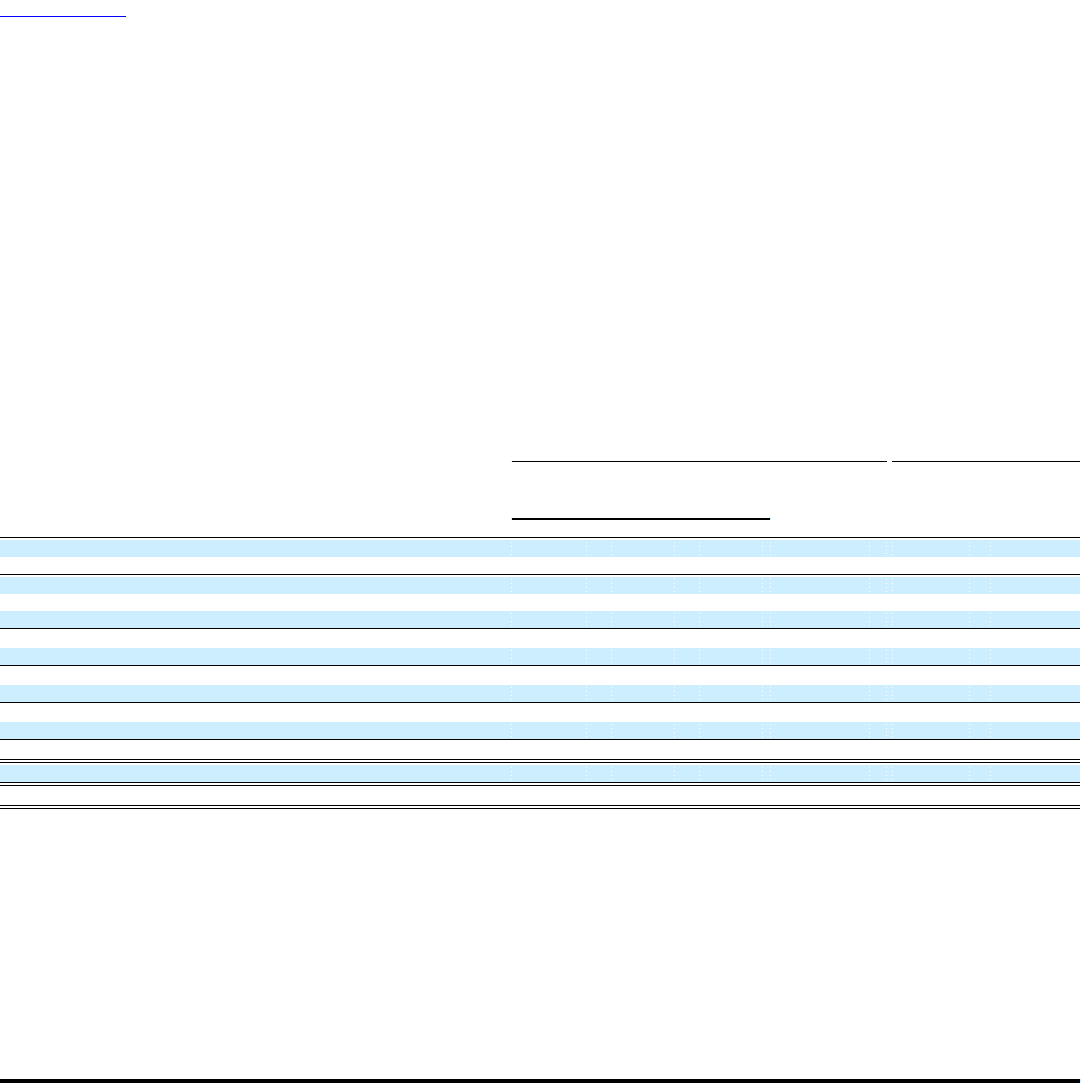
Table of Contents
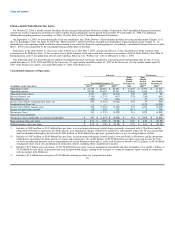
ITEM 6. SELECTED FINANCIAL DATA
On October 29, 2008, a wholly-owned subsidiary of ours merged with and into Northwest Airlines Corporation. Our Consolidated Financial Statements
include the results of operations of Northwest and its wholly-owned subsidiaries for the period from October 30 to December 31, 2008. For additional
information regarding purchase accounting, see Note 12 of the Notes to the Consolidated Financial Statements.
On September 15, 2005, we and substantially all of our subsidiaries (the "Delta Debtors") filed voluntary petitions for reorganization under Chapter 11 of
the U.S. Bankruptcy Code. On April 30, 2007 (the "Effective Date"), the Delta Debtors emerged from bankruptcy. Upon emergence from Chapter 11, we
adopted fresh start reporting which resulted in our becoming a new entity for financial reporting purposes. Accordingly, consolidated financial data on or after
May 1, 2007 is not comparable to the consolidated financial data prior to that date.
References in the tables below to "Successor" refer to Delta on or after May 1, 2007, after giving effect to (1) the cancellation of Delta common stock
issued prior to the Effective Date, (2) the issuance of new Delta common stock and certain debt securities in accordance with the Delta Debtors' Joint Plan of
Reorganization, and (3) the application of fresh start reporting. References to "Predecessor" refer to Delta prior to May 1, 2007.
The following tables are derived from our audited consolidated financial statements, and present selected financial and operating data for the (1) years
ended December 31, 2010, 2009 and 2008 of the Successor, (2) eight months ended December 31, 2007 of the Successor, (3) four months ended April 30,
2007 of the Predecessor and (4) year ended December 31, 2006 of the Predecessor.
Consolidated Summary of Operations
Successor Predecessor
Eight Four
Months Months
Ended Ended Year Ended
Year Ended December 31, December 31, April 30, December 31,
(in millions, except share data) 2010(1) 2009(2) 2008(3) 2007 2007(4) 2006(5)
Operating revenue $ 31,755 $ 28,063 $ 22,697 $ 13,358 $ 5,796 $ 17,532
Operating expense 29,538 28,387 31,011 12,562 5,496 17,474
Operating income (loss) 2,217 (324) (8,314) 796 300 58
Interest expense, net (1,185) (1,251) (613) (276) (248) (801)
Miscellaneous, net (424) (6) (114) 5 27 (19)
Income (loss) before reorganization items, net 608 (1,581) (9,041) 525 79 (762)
Reorganization items, net — — — — 1,215 (6,206)
Income (loss) before income taxes 608 (1,581) (9,041) 525 1,294 (6,968)
Income tax (provision) benefit (15) 344 119 (211) 4 765
Net income (loss) 593 (1,237) (8,922) 314 1,298 (6,203)
Preferred stock dividends — — — — — (2)
Net income (loss) attributable to common stockholders $ 593 $ (1,237) $ (8,922) $ 314 $ 1,298 $ (6,205)
Basic earnings (loss) per share $ 0.71 $ (1.50) $ (19.08) $ 0.80 $ 6.58 $ (31.58)
Diluted earnings (loss) per share $ 0.70 $ (1.50) $ (19.08) $ 0.79 $ 4.63 $ (31.58)
(1) Includes (a) $450 million, or $0.53 diluted loss per share, in restructuring and merger-related charges primarily associated with (i) Northwest and the
integration of Northwest operations into Delta and (ii) asset impairment charges related to the initiative to substantially reduce our 50-seat aircraft fleet
and retired dedicated freighter aircraft and (b) $401 million, or $0.48 diluted loss per share, primarily due to a loss on extinguishment of debt.
(2) Includes (a) $407 million, or $0.49 diluted loss per share, in restructuring and merger-related charges associated with (i) Northwest and the integration
of Northwest operations into Delta and (ii) severance and related costs, (b) an $83 million, or $0.10 diluted loss per share, non-cash loss for the write-
off of the unamortized discount on the extinguishment of certain Northwest debt and (c) a non-cash income tax benefit of $321 million, or $0.39 diluted
earnings per share, from our consideration of all income sources, including other comprehensive income.
(3) Includes a $7.3 billion non-cash charge, or $15.59 diluted loss per share, from an impairment of goodwill and other intangible assets and $1.1 billion, or
$2.42 diluted loss per share, in primarily non-cash merger-related charges relating to the issuance or vesting of employee equity awards in connection
with our merger with Northwest.
(4) Includes a $1.2 billion non-cash gain, or $5.20 diluted earnings per share, for reorganization items.
25