Delta Airlines 2010 Annual Report Download - page 89
Download and view the complete annual report
Please find page 89 of the 2010 Delta Airlines annual report below. You can navigate through the pages in the report by either clicking on the pages listed below, or by using the keyword search tool below to find specific information within the annual report.-
 1
1 -
2
-
3
-
4
-
5
-
6
-
7
-
8
-
9
-
10
-
11
-
12
-
13
-
14
-
15
-
16
-
17
-
18
-
19
-
20
-
21
-
22
-
23
-
24
-
25
-
26
-
27
-
28
-
29
-
30
-
31
-
32
-
33
-
34
-
35
-
36
-
37
-
38
-
39
-
40
-
41
-
42
-
43
-
44
-
45
-
46
-
47
-
48
-
49
-
50
-
51
-
52
-
53
-
54
-
55
-
56
-
57
-
58
-
59
-
60
-
61
-
62
-
63
-
64
-
65
-
66
-
67
-
68
-
69
-
70
-
71
-
72
-
73
-
74
-
75
-
76
-
77
-
78
-
 79
79 -
 80
80 -
 81
81 -
 82
82 -
 83
83 -
 84
84 -
 85
85 -
 86
86 -
 87
87 -
 88
88 -
 89
89 -
 90
90 -
 91
91 -
 92
92 -
 93
93 -
 94
94 -
 95
95 -
 96
96 -
 97
97 -
 98
98 -
 99
99 -
100
-
101
-
102
-
103
-
104
-
105
-
106
-
107
-
108
-
109
-
110
-
111
-
112
-
113
-
114
-
115
-
116
-
117
-
118
-
119
-
120
-
121
-
122
-
123
-
124
-
125
-
126
-
127
-
128
-
129
-
130
-
131
-
132
-
133
-
134
-
135
-
136
-
137
-
138
-
139
-
140
-
141
-
142
-
143
-
144
-
145
-
146
-
147
-
148
-
149
-
150
-
151
-
152
-
153
-
154
-
155
-
156
-
157
-
158
-
159
-
160
-
161
-
162
-
163
-
164
-
165
-
166
-
167
-
168
-
169
-
170
-
171
-
172
-
173
-
174
-
175
-
176
-
177
-
178
-
179
-
180
-
181
-
182
-
183
-
184
-
185
-
186
-
187
-
188
-
189
-
190
-
191
-
192
-
193
-
194
-
195
-
196
-
197
-
198
-
199
-
200
-
201
-
202
-
203
-
204
-
205
-
206
-
207
-
208
-
209
-
210
-
211
-
212
-
213
-
214
-
215
-
216
-
217
-
218
-
219
-
220
-
221
-
222
-
223
-
224
-
225
-
226
-
227
-
228
-
229
-
230
-
231
-
232
-
233
-
234
-
235
-
236
-
237
-
238
-
239
-
240
-
241
-
242
-
243
-
244
-
245
-
246
-
247
-
248
-
249
-
250
-
251
-
252
-
253
-
254
-
255
-
256
-
257
-
258
-
259
-
260
-
261
-
262
-
263
-
264
-
265
-
266
-
267
-
268
-
269
-
270
-
271
-
272
-
273
-
274
-
275
-
276
-
277
-
278
-
279
-
280
-
281
-
282
-
283
-
284
-
285
-
286
-
287
-
288
-
289
-
290
-
291
-
292
-
293
-
294
-
295
-
296
-
297
-
298
-
299
-
300
-
301
-
302
-
303
-
304
-
305
-
306
-
307
-
308
-
309
-
310
-
311
-
312
-
313
-
314
-
315
-
316
-
317
-
318
-
319
-
320
-
321
-
322
-
323
-
324
-
325
-
326
-
327
-
328
-
329
-
330
-
331
-
332
-
333
-
334
-
335
-
336
-
337
-
338
-
339
-
340
-
341
-
342
-
343
-
344
-
345
-
346
-
347
-
348
-
349
-
350
-
351
-
352
-
353
-
354
-
355
-
356
-
357
-
358
-
359
-
360
-
361
-
362
-
363
-
364
-
365
-
366
-
367
-
368
-
369
-
370
-
371
-
372
-
373
-
374
-
375
-
376
-
377
-
378
-
379
-
380
-
381
-
382
-
383
-
384
-
385
-
386
-
387
-
388
-
389
-
390
-
391
-
392
-
393
-
394
-
395
-
396
-
397
-
398
-
399
-
400
-
401
-
402
-
403
-
404
-
405
-
406
-
407
-
408
-
409
-
410
-
411
-
412
-
413
-
414
-
415
-
416
-
417
-
418
-
419
-
420
-
421
-
422
-
423
-
424
-
425
-
426
-
427
-
428
-
429
-
430
-
431
-
432
-
433
-
434
-
435
-
436
-
437
-
438
-
439
-
440
-
441
-
442
-
443
-
444
-
445
-
446
-
447
 |
 |

Table of Contents
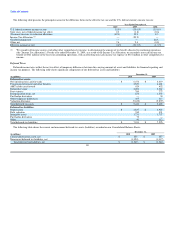
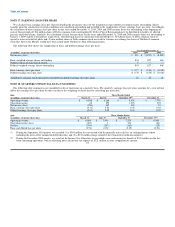
Assumed healthcare cost trend rates have an effect on the amounts reported for the other postretirement benefit plans. A 1% change in the healthcare cost
trend rate used in measuring the accumulated plan benefit obligation ("APBO") for these plans at December 31, 2010, would have the following effects:
(in millions) 1% Increase 1% Decrease
Increase (decrease) in total service and interest cost $ 6 $ (6)
Increase (decrease) in the APBO $ 49 $ (59)
The expected long-term rate of return on plan assets is based primarily on plan-specific investment studies using historical market return and volatility data
with forward looking estimates based on existing financial market conditions and forecasts. Modest excess return expectations versus some market indices are
incorporated into the return projections based on the actively managed structure of the investment programs and their records of achieving such returns
historically. We review our rate of return on plan asset assumptions annually. These assumptions are largely based on the asset category rate-of-return
assumptions developed annually with our pension plan investment advisors. The advisors' asset category return assumptions are based in part on a review of
historical asset returns, but also emphasize current market conditions to develop estimates of future risk and return.
Plan Assets. We have adopted and implemented investment policies for our defined benefit pension plans and disability and survivorship plan for pilots
that incorporate strategic asset allocation mixes intended to best meet the plans' long-term obligations. This asset allocation policy mix utilizes a diversified
mix of investments and is reviewed periodically. The weighted-average target and actual asset allocations for the plans are as follows:
Weighted-Average
Target December 31,
(in millions) Allocations 2010 2009
Domestic equity securities 40% $ 3,234 $ 3,435
Non-U.S. developed equity securities 18% 1,695 1,384
Diversified fixed income 17% 1,275 1,372
Private equity / real estate / natural resources 15% 1,890 1,552
Non-U.S. emerging equity securities 5% 449 422
High yield fixed income 5% 397 372
Cash equivalents 0% 429 239
Total 100% $ 9,369 $ 8,776
The overall asset mix of the portfolios is more heavily weighted in equity-like investments. Active management strategies are utilized where feasible in an
effort to realize investment returns in excess of market indices. For additional information regarding the fair value of pension assets, see Note 2.
85