Delta Airlines 2010 Annual Report Download - page 65
Download and view the complete annual report
Please find page 65 of the 2010 Delta Airlines annual report below. You can navigate through the pages in the report by either clicking on the pages listed below, or by using the keyword search tool below to find specific information within the annual report.-
 1
1 -
2
-
3
-
4
-
5
-
6
-
7
-
8
-
9
-
10
-
11
-
12
-
13
-
14
-
15
-
16
-
17
-
18
-
19
-
20
-
21
-
22
-
23
-
24
-
25
-
26
-
27
-
28
-
29
-
30
-
31
-
32
-
33
-
34
-
35
-
36
-
37
-
38
-
39
-
40
-
41
-
42
-
43
-
44
-
45
-
46
-
47
-
48
-
49
-
50
-
51
-
52
-
53
-
54
-
 55
55 -
 56
56 -
 57
57 -
 58
58 -
 59
59 -
 60
60 -
 61
61 -
 62
62 -
 63
63 -
 64
64 -
 65
65 -
 66
66 -
 67
67 -
 68
68 -
 69
69 -
 70
70 -
 71
71 -
 72
72 -
 73
73 -
 74
74 -
 75
75 -
76
-
77
-
78
-
79
-
80
-
81
-
82
-
83
-
84
-
85
-
86
-
87
-
88
-
89
-
90
-
91
-
92
-
93
-
94
-
95
-
96
-
97
-
98
-
99
-
100
-
101
-
102
-
103
-
104
-
105
-
106
-
107
-
108
-
109
-
110
-
111
-
112
-
113
-
114
-
115
-
116
-
117
-
118
-
119
-
120
-
121
-
122
-
123
-
124
-
125
-
126
-
127
-
128
-
129
-
130
-
131
-
132
-
133
-
134
-
135
-
136
-
137
-
138
-
139
-
140
-
141
-
142
-
143
-
144
-
145
-
146
-
147
-
148
-
149
-
150
-
151
-
152
-
153
-
154
-
155
-
156
-
157
-
158
-
159
-
160
-
161
-
162
-
163
-
164
-
165
-
166
-
167
-
168
-
169
-
170
-
171
-
172
-
173
-
174
-
175
-
176
-
177
-
178
-
179
-
180
-
181
-
182
-
183
-
184
-
185
-
186
-
187
-
188
-
189
-
190
-
191
-
192
-
193
-
194
-
195
-
196
-
197
-
198
-
199
-
200
-
201
-
202
-
203
-
204
-
205
-
206
-
207
-
208
-
209
-
210
-
211
-
212
-
213
-
214
-
215
-
216
-
217
-
218
-
219
-
220
-
221
-
222
-
223
-
224
-
225
-
226
-
227
-
228
-
229
-
230
-
231
-
232
-
233
-
234
-
235
-
236
-
237
-
238
-
239
-
240
-
241
-
242
-
243
-
244
-
245
-
246
-
247
-
248
-
249
-
250
-
251
-
252
-
253
-
254
-
255
-
256
-
257
-
258
-
259
-
260
-
261
-
262
-
263
-
264
-
265
-
266
-
267
-
268
-
269
-
270
-
271
-
272
-
273
-
274
-
275
-
276
-
277
-
278
-
279
-
280
-
281
-
282
-
283
-
284
-
285
-
286
-
287
-
288
-
289
-
290
-
291
-
292
-
293
-
294
-
295
-
296
-
297
-
298
-
299
-
300
-
301
-
302
-
303
-
304
-
305
-
306
-
307
-
308
-
309
-
310
-
311
-
312
-
313
-
314
-
315
-
316
-
317
-
318
-
319
-
320
-
321
-
322
-
323
-
324
-
325
-
326
-
327
-
328
-
329
-
330
-
331
-
332
-
333
-
334
-
335
-
336
-
337
-
338
-
339
-
340
-
341
-
342
-
343
-
344
-
345
-
346
-
347
-
348
-
349
-
350
-
351
-
352
-
353
-
354
-
355
-
356
-
357
-
358
-
359
-
360
-
361
-
362
-
363
-
364
-
365
-
366
-
367
-
368
-
369
-
370
-
371
-
372
-
373
-
374
-
375
-
376
-
377
-
378
-
379
-
380
-
381
-
382
-
383
-
384
-
385
-
386
-
387
-
388
-
389
-
390
-
391
-
392
-
393
-
394
-
395
-
396
-
397
-
398
-
399
-
400
-
401
-
402
-
403
-
404
-
405
-
406
-
407
-
408
-
409
-
410
-
411
-
412
-
413
-
414
-
415
-
416
-
417
-
418
-
419
-
420
-
421
-
422
-
423
-
424
-
425
-
426
-
427
-
428
-
429
-
430
-
431
-
432
-
433
-
434
-
435
-
436
-
437
-
438
-
439
-
440
-
441
-
442
-
443
-
444
-
445
-
446
-
447
 |
 |

Table of Contents
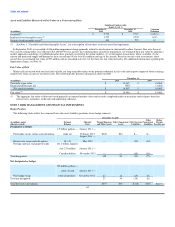
Common Stock. Common stock is valued at the closing price reported on the active market on which the individual securities are traded.
Mutual and Commingled Funds. These funds are valued using the net asset value divided by the number of shares outstanding, which is based on quoted
market prices of the underlying assets owned by the fund.
Alternative Investments. The valuation of alternative investments requires significant judgment due to the absence of quoted market prices as well as the
inherent lack of liquidity and the long-term nature of these assets. Accordingly, these assets are generally classified in Level 3. Alternative investments
include private equity, real estate, energy and timberland. Investments are valued based on recommendations of our investment managers who use valuation
models where one or more of the significant inputs into the model cannot be observed and which require the development of assumptions. We also assess the
potential for adjustment to the fair value of these investments due to the lag in the availability of data. In these cases, we solicit preliminary valuation updates
at year-end from the investment managers and use that information and corroborating data from public markets to determine any needed adjustments to fair
value.
Fixed Income. Investments include corporate bonds, government bonds, collateralized mortgage obligations and other asset backed securities. These
investments are generally valued at the bid price or the average of the bid and asked price. Prices are obtained from independent pricing services and are based
on pricing models, quoted prices of securities with similar characteristics, or broker quotes.
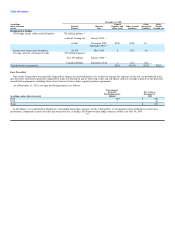
Foreign Currency Derivatives. Our foreign currency derivative instruments consist of various forward contracts and are valued based on data readily
observable in public markets.
Cash Equivalents and Other. These investments primarily consist of short term investment funds which are valued using the net asset value based on the
value of the underlying assets minus the liabilities and then divided by the number of shares outstanding. Cash is not included in the table above.
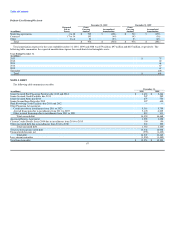
Assets Measured at Fair Value on a Recurring Basis Using Significant Unobservable Inputs (Level 3)
December 31, 2010 December 31, 2009 December 31, 2008
Hedge Hedge
Benefit Plan Derivatives Benefit Plan Derivatives
(in millions) Assets Asset, Net Assets Liability, Net
Balance at beginning of period $ 1,633 $ (1,091) $ 1,797 $ —
Liabilities assumed from Northwest (—) — — (567)
Change in fair value included in earnings — (1,232) — (203)
Change in fair value included in other comprehensive income (loss) 264 1,230 (56) (1,298)
Purchases and settlements, net 65 1,199 (108) 924
Transfers from/to Level 3(1) — (106) — 53
Balance at end of period $ 1,962 $ — $ 1,633 $ (1,091)
(1) During 2008, we reevaluated certain valuation inputs used for our option contracts. As a result, we reclassified these contracts from Level 2 to Level 3
since valuation at December 31, 2007. During 2009, we implemented systems that better provide for the evaluation of these inputs against market data
and ceased reliance on data provided by counterparties as a source for our valuation assessments. As a result, we reclassified our option contracts to
Level 2.
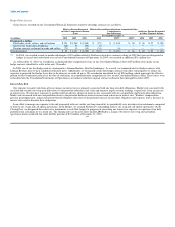
(Losses) gains included in earnings above for hedge derivatives for the year ended December 31, 2009 are recorded on our Consolidated Statements of
Operations as follows:
December 31, 2009 December 31, 2008
Aircraft Fuel Other Aircraft Fuel Other
Expense and Related (Expense) Expense and Related (Expense)
(in millions) Taxes Income Taxes Income
Total (losses) gains included in earnings $ (1,263) $ 31 $ (176) $ (27)
Change in unrealized gains (losses) relating to assets and liabilities still held at end of period $ — $ 26 $ (91) $ (5)
61