Delta Airlines 2010 Annual Report Download - page 442
Download and view the complete annual report
Please find page 442 of the 2010 Delta Airlines annual report below. You can navigate through the pages in the report by either clicking on the pages listed below, or by using the keyword search tool below to find specific information within the annual report.-
 1
1 -
2
-
3
-
4
-
5
-
6
-
7
-
8
-
9
-
10
-
11
-
12
-
13
-
14
-
15
-
16
-
17
-
18
-
19
-
20
-
21
-
22
-
23
-
24
-
25
-
26
-
27
-
28
-
29
-
30
-
31
-
32
-
33
-
34
-
35
-
36
-
37
-
38
-
39
-
40
-
41
-
42
-
43
-
44
-
45
-
46
-
47
-
48
-
49
-
50
-
51
-
52
-
53
-
54
-
55
-
56
-
57
-
58
-
59
-
60
-
61
-
62
-
63
-
64
-
65
-
66
-
67
-
68
-
69
-
70
-
71
-
72
-
73
-
74
-
75
-
76
-
77
-
78
-
79
-
80
-
81
-
82
-
83
-
84
-
85
-
86
-
87
-
88
-
89
-
90
-
91
-
92
-
93
-
94
-
95
-
96
-
97
-
98
-
99
-
100
-
101
-
102
-
103
-
104
-
105
-
106
-
107
-
108
-
109
-
110
-
111
-
112
-
113
-
114
-
115
-
116
-
117
-
118
-
119
-
120
-
121
-
122
-
123
-
124
-
125
-
126
-
127
-
128
-
129
-
130
-
131
-
132
-
133
-
134
-
135
-
136
-
137
-
138
-
139
-
140
-
141
-
142
-
143
-
144
-
145
-
146
-
147
-
148
-
149
-
150
-
151
-
152
-
153
-
154
-
155
-
156
-
157
-
158
-
159
-
160
-
161
-
162
-
163
-
164
-
165
-
166
-
167
-
168
-
169
-
170
-
171
-
172
-
173
-
174
-
175
-
176
-
177
-
178
-
179
-
180
-
181
-
182
-
183
-
184
-
185
-
186
-
187
-
188
-
189
-
190
-
191
-
192
-
193
-
194
-
195
-
196
-
197
-
198
-
199
-
200
-
201
-
202
-
203
-
204
-
205
-
206
-
207
-
208
-
209
-
210
-
211
-
212
-
213
-
214
-
215
-
216
-
217
-
218
-
219
-
220
-
221
-
222
-
223
-
224
-
225
-
226
-
227
-
228
-
229
-
230
-
231
-
232
-
233
-
234
-
235
-
236
-
237
-
238
-
239
-
240
-
241
-
242
-
243
-
244
-
245
-
246
-
247
-
248
-
249
-
250
-
251
-
252
-
253
-
254
-
255
-
256
-
257
-
258
-
259
-
260
-
261
-
262
-
263
-
264
-
265
-
266
-
267
-
268
-
269
-
270
-
271
-
272
-
273
-
274
-
275
-
276
-
277
-
278
-
279
-
280
-
281
-
282
-
283
-
284
-
285
-
286
-
287
-
288
-
289
-
290
-
291
-
292
-
293
-
294
-
295
-
296
-
297
-
298
-
299
-
300
-
301
-
302
-
303
-
304
-
305
-
306
-
307
-
308
-
309
-
310
-
311
-
312
-
313
-
314
-
315
-
316
-
317
-
318
-
319
-
320
-
321
-
322
-
323
-
324
-
325
-
326
-
327
-
328
-
329
-
330
-
331
-
332
-
333
-
334
-
335
-
336
-
337
-
338
-
339
-
340
-
341
-
342
-
343
-
344
-
345
-
346
-
347
-
348
-
349
-
350
-
351
-
352
-
353
-
354
-
355
-
356
-
357
-
358
-
359
-
360
-
361
-
362
-
363
-
364
-
365
-
366
-
367
-
368
-
369
-
370
-
371
-
372
-
373
-
374
-
375
-
376
-
377
-
378
-
379
-
380
-
381
-
382
-
383
-
384
-
385
-
386
-
387
-
388
-
389
-
390
-
391
-
392
-
393
-
394
-
395
-
396
-
397
-
398
-
399
-
400
-
401
-
402
-
403
-
404
-
405
-
406
-
407
-
408
-
409
-
410
-
411
-
412
-
413
-
414
-
415
-
416
-
417
-
418
-
419
-
420
-
421
-
422
-
423
-
424
-
425
-
426
-
427
-
428
-
429
-
430
-
431
-
 432
432 -
 433
433 -
 434
434 -
 435
435 -
 436
436 -
 437
437 -
 438
438 -
 439
439 -
 440
440 -
 441
441 -
 442
442 -
 443
443 -
 444
444 -
 445
445 -
 446
446 -
 447
447
 |
 |
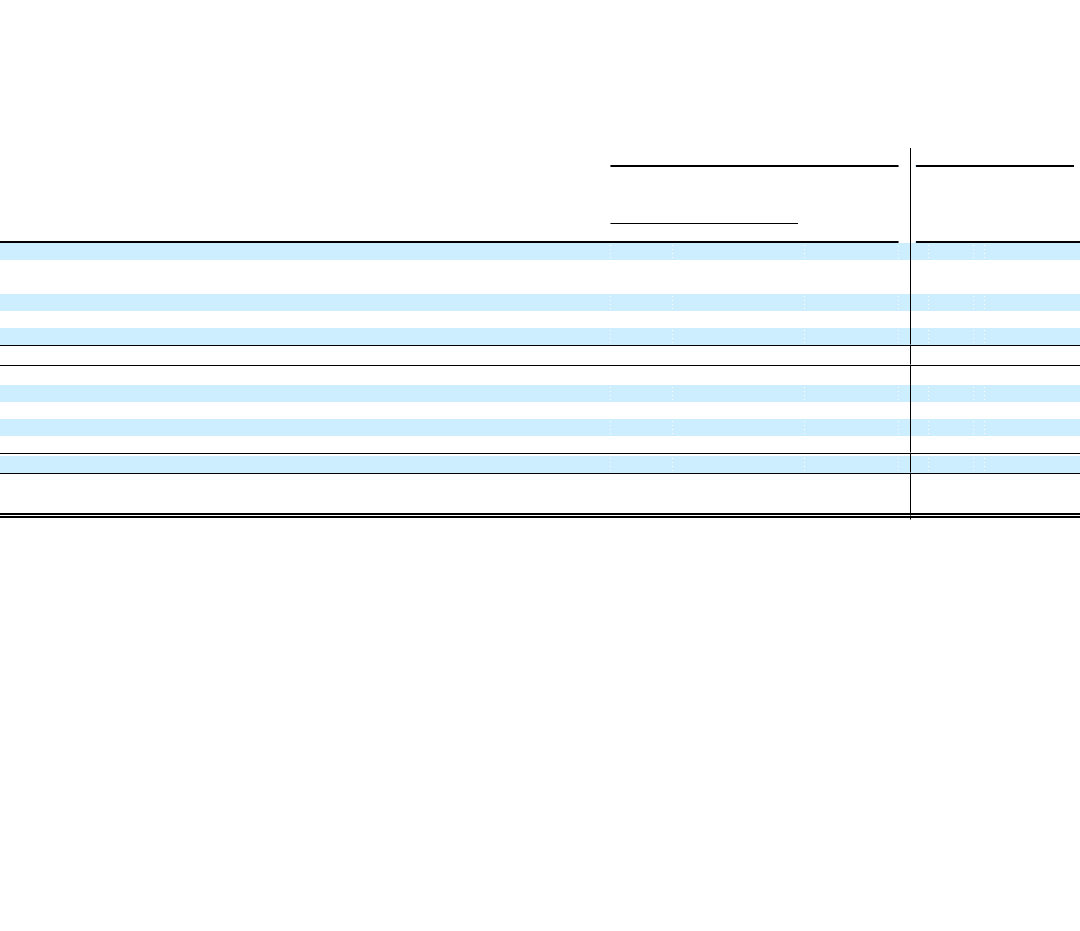
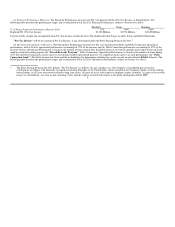
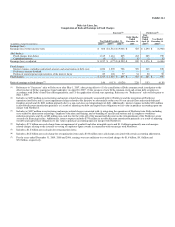
Exhibit 12.1
Delta Air Lines, Inc.
Computation of Ratio of Earnings to Fixed Charges
Successor(1) Predecessor(1)
Four
Eight Months Months
Ended Ended Year Ended
Year Ended December 31, December 31, April 30, December 31,
(in millions, except for ratio data) 2010(2) 2009(3) 2008(4) 2007 2007(5) 2006(6)
Earnings (loss):
Earnings (loss) before income taxes $ 608 $ (1,581) $ (9,041) $ 525 $ 1,294 $ (6,968)
Add (deduct):
Fixed charges from below 1,315 1,416 805 432 285 970
Capitalized interest (6) (12) (23) (8) (3) (8)
Earnings (loss) as adjusted $ 1,917 $ (177) $ (8,259) $ 949 $ 1,576 $ (6,006)
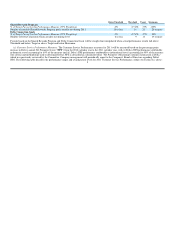
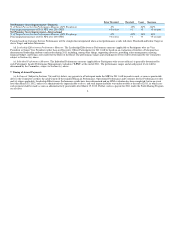
Fixed charges:
Interest expense, including capitalized amounts and amortization of debt costs 1,226 1,290 728 398 265 878
Preference security dividend — — — — — 2
Portion of rental expense representative of the interest factor 89 126 77 34 20 90
Fixed charges $ 1,315 $ 1,416 $ 805 $ 432 $ 285 $ 970
Ratio of earnings to fixed charges(7) 1.46 (0.13) (10.26) 2.20 5.53 (6.19)
(1) References to "Successor" refer to Delta on or after May 1, 2007, after giving effect to (1) the cancellation of Delta common stock issued prior to the
effective date of Delta's emergence from bankruptcy on April 30, 2007; (2) the issuance of new Delta common stock and certain debt securities in
accordance with Delta's Joint Plan of Reorganization; and (3) the application of fresh start reporting. References to "Predecessor" refer to Delta prior to
May 1, 2007.
(2) Includes (a) $450 million in restructuring and merger-related charges primarily associated with (i) Northwest and the integration of Northwest
operations into Delta and (ii) asset impairment charges related to the initiative to substantially reduce our 50-seat aircraft fleet and retired dedicated
freighter aircraft and (b) $401 million primarily due to a non-cash loss on extinguishment of debt. Additionally, interest expense includes $216 million
in net debt discount amortization primarily as a result of adjusting our debt and capital lease obligations to fair value in purchase accounting upon our
merger with Northwest.
(3) Includes (a) $407 million in restructuring and merger-related charges associated with (i) integrating the operations of Northwest into Delta, including
costs related to information technology, employee relocation and training, and re-branding of aircraft and stations and (ii) employee workforce
reduction programs and (b) an $83 million non-cash loss for the write-off of the unamortized discount on the extinguishment of the Northwest senior
secured exit financing facility. Additionally, interest expense includes $370 million in net debt discount amortization primarily as a result of adjusting
our debt and capital lease obligations to fair value in purchase accounting upon our merger with Northwest.
(4) Includes a $7.3 billion non-cash charge from an impairment of goodwill and other intangible assets and $1.1 billion in primarily non-cash merger-
related charges relating to the issuance or vesting of employee equity awards in connection with our merger with Northwest.
(5) Includes a $1.2 billion non-cash gain for reorganization items.
(6) Includes a $6.2 billion non-cash charge for reorganization items and a $310 million non-cash charge associated with certain accounting adjustments.
(7) For the years ended December 31, 2009, 2008 and 2006, earnings were not sufficient to cover fixed charges by $1.6 billion, $9.1 billion and
$7.0 billion, respectively.