Delta Airlines 2010 Annual Report Download - page 32
Download and view the complete annual report
Please find page 32 of the 2010 Delta Airlines annual report below. You can navigate through the pages in the report by either clicking on the pages listed below, or by using the keyword search tool below to find specific information within the annual report.-
 1
1 -
2
-
3
-
4
-
5
-
6
-
7
-
8
-
9
-
10
-
11
-
12
-
13
-
14
-
15
-
16
-
17
-
18
-
19
-
20
-
21
-
 22
22 -
 23
23 -
 24
24 -
 25
25 -
 26
26 -
 27
27 -
 28
28 -
 29
29 -
 30
30 -
 31
31 -
 32
32 -
 33
33 -
 34
34 -
 35
35 -
 36
36 -
 37
37 -
 38
38 -
 39
39 -
 40
40 -
 41
41 -
 42
42 -
43
-
44
-
45
-
46
-
47
-
48
-
49
-
50
-
51
-
52
-
53
-
54
-
55
-
56
-
57
-
58
-
59
-
60
-
61
-
62
-
63
-
64
-
65
-
66
-
67
-
68
-
69
-
70
-
71
-
72
-
73
-
74
-
75
-
76
-
77
-
78
-
79
-
80
-
81
-
82
-
83
-
84
-
85
-
86
-
87
-
88
-
89
-
90
-
91
-
92
-
93
-
94
-
95
-
96
-
97
-
98
-
99
-
100
-
101
-
102
-
103
-
104
-
105
-
106
-
107
-
108
-
109
-
110
-
111
-
112
-
113
-
114
-
115
-
116
-
117
-
118
-
119
-
120
-
121
-
122
-
123
-
124
-
125
-
126
-
127
-
128
-
129
-
130
-
131
-
132
-
133
-
134
-
135
-
136
-
137
-
138
-
139
-
140
-
141
-
142
-
143
-
144
-
145
-
146
-
147
-
148
-
149
-
150
-
151
-
152
-
153
-
154
-
155
-
156
-
157
-
158
-
159
-
160
-
161
-
162
-
163
-
164
-
165
-
166
-
167
-
168
-
169
-
170
-
171
-
172
-
173
-
174
-
175
-
176
-
177
-
178
-
179
-
180
-
181
-
182
-
183
-
184
-
185
-
186
-
187
-
188
-
189
-
190
-
191
-
192
-
193
-
194
-
195
-
196
-
197
-
198
-
199
-
200
-
201
-
202
-
203
-
204
-
205
-
206
-
207
-
208
-
209
-
210
-
211
-
212
-
213
-
214
-
215
-
216
-
217
-
218
-
219
-
220
-
221
-
222
-
223
-
224
-
225
-
226
-
227
-
228
-
229
-
230
-
231
-
232
-
233
-
234
-
235
-
236
-
237
-
238
-
239
-
240
-
241
-
242
-
243
-
244
-
245
-
246
-
247
-
248
-
249
-
250
-
251
-
252
-
253
-
254
-
255
-
256
-
257
-
258
-
259
-
260
-
261
-
262
-
263
-
264
-
265
-
266
-
267
-
268
-
269
-
270
-
271
-
272
-
273
-
274
-
275
-
276
-
277
-
278
-
279
-
280
-
281
-
282
-
283
-
284
-
285
-
286
-
287
-
288
-
289
-
290
-
291
-
292
-
293
-
294
-
295
-
296
-
297
-
298
-
299
-
300
-
301
-
302
-
303
-
304
-
305
-
306
-
307
-
308
-
309
-
310
-
311
-
312
-
313
-
314
-
315
-
316
-
317
-
318
-
319
-
320
-
321
-
322
-
323
-
324
-
325
-
326
-
327
-
328
-
329
-
330
-
331
-
332
-
333
-
334
-
335
-
336
-
337
-
338
-
339
-
340
-
341
-
342
-
343
-
344
-
345
-
346
-
347
-
348
-
349
-
350
-
351
-
352
-
353
-
354
-
355
-
356
-
357
-
358
-
359
-
360
-
361
-
362
-
363
-
364
-
365
-
366
-
367
-
368
-
369
-
370
-
371
-
372
-
373
-
374
-
375
-
376
-
377
-
378
-
379
-
380
-
381
-
382
-
383
-
384
-
385
-
386
-
387
-
388
-
389
-
390
-
391
-
392
-
393
-
394
-
395
-
396
-
397
-
398
-
399
-
400
-
401
-
402
-
403
-
404
-
405
-
406
-
407
-
408
-
409
-
410
-
411
-
412
-
413
-
414
-
415
-
416
-
417
-
418
-
419
-
420
-
421
-
422
-
423
-
424
-
425
-
426
-
427
-
428
-
429
-
430
-
431
-
432
-
433
-
434
-
435
-
436
-
437
-
438
-
439
-
440
-
441
-
442
-
443
-
444
-
445
-
446
-
447
 |
 |
Table of Contents
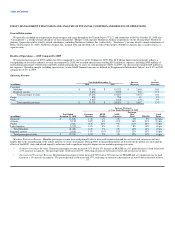
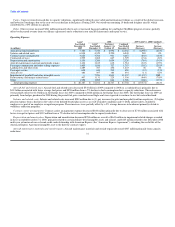
Regional carriers. Passenger revenue of regional carriers increased 11% from a 13% increase in PRASM and a 1.0 point increase in load factor on a 2%
decline in capacity. The passenger mile yield increased 12%, reflecting an increase in demand for air travel and an increase in fares.
Cargo. Cargo revenue increased due to a 13% increase in yield and a 25% increase in volume, primarily in international markets, partially offset by
capacity reductions due to the retirement of our dedicated freighter aircraft in 2009.
Other. Other revenue increased due to higher baggage fee revenue from an increased volume of checked bags.
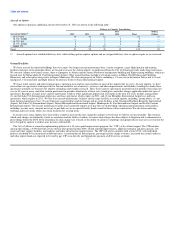
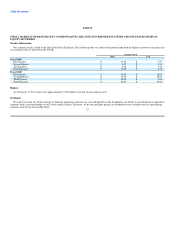
Operating Expense
Year Ended
December 31, Increase % Increase
(in millions) 2010 2009 (Decrease) (Decrease)
Aircraft fuel and related taxes $ 7,594 $ 7,384 $ 210 3%
Salaries and related costs 6,751 6,838 (87) (1)%
Contract carrier arrangements 4,305 3,823 482 13%
Aircraft maintenance materials and outside repairs 1,569 1,434 135 9%
Contracted services 1,549 1,595 (46) (3)%
Depreciation and amortization 1,511 1,536 (25) (2)%
Passenger commissions and other selling expenses 1,509 1,405 104 7%
Landing fees and other rents 1,281 1,289 (8) (1)%
Passenger service 673 638 35 5%
Aircraft rent 387 480 (93) (19)%
Profit sharing 313 — 313 NM(1)
Restructuring and merger-related items 450 407 43 11%
Other 1,646 1,558 88 6%
Total operating expense $ 29,538 $ 28,387 $ 1,151 4%
(1) NM — not meaningful
On July 1, 2010, we sold Compass Airlines, Inc. ("Compass") and Mesaba Aviation, Inc. ("Mesaba") to Trans States Airlines, Inc. ("Trans States") and
Pinnacle Airlines Corp. ("Pinnacle"), respectively. Upon the closing of these transactions, we entered into new or amended long-term capacity purchase
agreements with Compass, Mesaba and Pinnacle. Prior to these sales, expenses related to Compass and Mesaba as our wholly-owned subsidiaries were
reported in the applicable expense line items. Subsequent to these sales, expenses related to Compass and Mesaba are reported as contract carrier
arrangements expense.
Aircraft fuel and related taxes. Aircraft fuel and related taxes increased due to higher average unhedged fuel prices, which increased fuel costs $1.6 billion,
partially offset by reductions of $1.3 billion in fuel hedge costs and $156 million from the change in reporting described above due to the transactions
involving Compass and Mesaba. We recorded $89 million in net fuel hedge costs for 2010, compared to $1.4 billion in 2009. The fuel hedge costs for 2009
were primarily from losses on hedge contracts purchased in 2008 when fuel prices reached record highs and were expected to continue to rise but instead
declined.
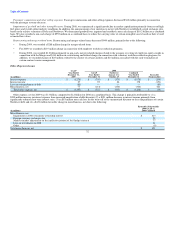
Contract carrier arrangements. Contract carrier arrangements expense increased primarily due to higher average fuel prices and the change in reporting
described above due to the transactions involving Compass and Mesaba.
Aircraft maintenance materials and outside repairs. Aircraft maintenance materials and outside repairs expense increased primarily due to returning
aircraft to service after temporary storage, as well as the timing of engine and airframe maintenance volumes.
Passenger commissions and other selling expenses. Passenger commissions and other selling expenses increased primarily due to higher revenue-related
expenses, such as booking fees and sales commissions, from the increase in revenue.
Profit sharing. We recorded $313 million related to our broad-based employee profit sharing plans for 2010. We did not record any profit sharing expense
in 2009. Our broad-based profit sharing plans provide that, for each year in which we have an annual pre-tax profit (as defined in the plan document), we will
pay a specified portion of that profit to eligible employees.
28