Delta Airlines 2010 Annual Report Download - page 36
Download and view the complete annual report
Please find page 36 of the 2010 Delta Airlines annual report below. You can navigate through the pages in the report by either clicking on the pages listed below, or by using the keyword search tool below to find specific information within the annual report.-
 1
1 -
2
-
3
-
4
-
5
-
6
-
7
-
8
-
9
-
10
-
11
-
12
-
13
-
14
-
15
-
16
-
17
-
18
-
19
-
20
-
21
-
22
-
23
-
24
-
25
-
 26
26 -
 27
27 -
 28
28 -
 29
29 -
 30
30 -
 31
31 -
 32
32 -
 33
33 -
 34
34 -
 35
35 -
 36
36 -
 37
37 -
 38
38 -
 39
39 -
 40
40 -
 41
41 -
 42
42 -
 43
43 -
 44
44 -
 45
45 -
 46
46 -
47
-
48
-
49
-
50
-
51
-
52
-
53
-
54
-
55
-
56
-
57
-
58
-
59
-
60
-
61
-
62
-
63
-
64
-
65
-
66
-
67
-
68
-
69
-
70
-
71
-
72
-
73
-
74
-
75
-
76
-
77
-
78
-
79
-
80
-
81
-
82
-
83
-
84
-
85
-
86
-
87
-
88
-
89
-
90
-
91
-
92
-
93
-
94
-
95
-
96
-
97
-
98
-
99
-
100
-
101
-
102
-
103
-
104
-
105
-
106
-
107
-
108
-
109
-
110
-
111
-
112
-
113
-
114
-
115
-
116
-
117
-
118
-
119
-
120
-
121
-
122
-
123
-
124
-
125
-
126
-
127
-
128
-
129
-
130
-
131
-
132
-
133
-
134
-
135
-
136
-
137
-
138
-
139
-
140
-
141
-
142
-
143
-
144
-
145
-
146
-
147
-
148
-
149
-
150
-
151
-
152
-
153
-
154
-
155
-
156
-
157
-
158
-
159
-
160
-
161
-
162
-
163
-
164
-
165
-
166
-
167
-
168
-
169
-
170
-
171
-
172
-
173
-
174
-
175
-
176
-
177
-
178
-
179
-
180
-
181
-
182
-
183
-
184
-
185
-
186
-
187
-
188
-
189
-
190
-
191
-
192
-
193
-
194
-
195
-
196
-
197
-
198
-
199
-
200
-
201
-
202
-
203
-
204
-
205
-
206
-
207
-
208
-
209
-
210
-
211
-
212
-
213
-
214
-
215
-
216
-
217
-
218
-
219
-
220
-
221
-
222
-
223
-
224
-
225
-
226
-
227
-
228
-
229
-
230
-
231
-
232
-
233
-
234
-
235
-
236
-
237
-
238
-
239
-
240
-
241
-
242
-
243
-
244
-
245
-
246
-
247
-
248
-
249
-
250
-
251
-
252
-
253
-
254
-
255
-
256
-
257
-
258
-
259
-
260
-
261
-
262
-
263
-
264
-
265
-
266
-
267
-
268
-
269
-
270
-
271
-
272
-
273
-
274
-
275
-
276
-
277
-
278
-
279
-
280
-
281
-
282
-
283
-
284
-
285
-
286
-
287
-
288
-
289
-
290
-
291
-
292
-
293
-
294
-
295
-
296
-
297
-
298
-
299
-
300
-
301
-
302
-
303
-
304
-
305
-
306
-
307
-
308
-
309
-
310
-
311
-
312
-
313
-
314
-
315
-
316
-
317
-
318
-
319
-
320
-
321
-
322
-
323
-
324
-
325
-
326
-
327
-
328
-
329
-
330
-
331
-
332
-
333
-
334
-
335
-
336
-
337
-
338
-
339
-
340
-
341
-
342
-
343
-
344
-
345
-
346
-
347
-
348
-
349
-
350
-
351
-
352
-
353
-
354
-
355
-
356
-
357
-
358
-
359
-
360
-
361
-
362
-
363
-
364
-
365
-
366
-
367
-
368
-
369
-
370
-
371
-
372
-
373
-
374
-
375
-
376
-
377
-
378
-
379
-
380
-
381
-
382
-
383
-
384
-
385
-
386
-
387
-
388
-
389
-
390
-
391
-
392
-
393
-
394
-
395
-
396
-
397
-
398
-
399
-
400
-
401
-
402
-
403
-
404
-
405
-
406
-
407
-
408
-
409
-
410
-
411
-
412
-
413
-
414
-
415
-
416
-
417
-
418
-
419
-
420
-
421
-
422
-
423
-
424
-
425
-
426
-
427
-
428
-
429
-
430
-
431
-
432
-
433
-
434
-
435
-
436
-
437
-
438
-
439
-
440
-
441
-
442
-
443
-
444
-
445
-
446
-
447
 |
 |
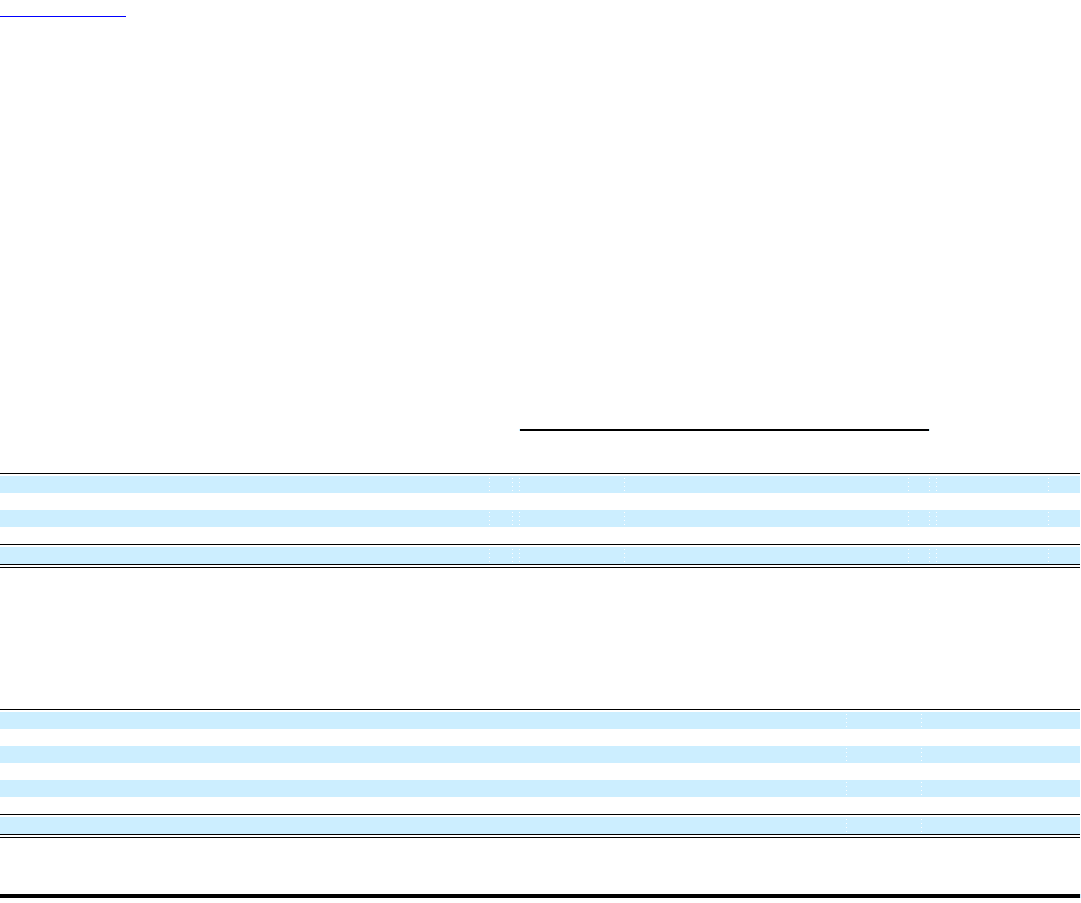
Table of Contents
Passenger commissions and other selling expenses. Passenger commissions and other selling expenses decreased $362 million primarily in connection
with the passenger revenue decrease.
Impairment of goodwill and other intangible assets. During 2008, we experienced a significant decline in market capitalization primarily from record high
fuel prices and overall airline industry conditions. In addition, the announcement of our intention to merge with Northwest established a stock exchange ratio
based on the relative valuation of Delta and Northwest. We determined goodwill was impaired and recorded a non-cash charge of $10.2 billion on a combined
basis. We also recorded a non-cash charge of $955 million on a combined basis to reduce the carrying value of certain intangible assets based on their revised
estimated fair values.
Restructuring and merger-related items. Restructuring and merger-related items decreased $949 million, primarily due to the following:
• During 2009, we recorded a $288 million charge for merger-related items.
• For 2009, we recorded a $119 million charge in connection with employee workforce reduction programs.
• During 2008, we recorded $1.2 billion primarily in non-cash, merger-related charges related to the issuance or vesting of employee equity awards in
connection with the Merger and $114 million in restructuring and related charges in connection with voluntary workforce reduction programs. In
addition, we recorded charges of $25 million related to the closure of certain facilities and $14 million associated with the early termination of
certain contract carrier arrangements.
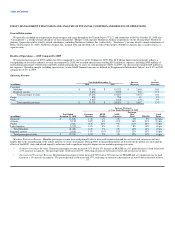
Other (Expense) Income
GAAP 2008
Year Ended GAAP Northwest Combined
December 31, Year Ended January 1 to Year Ended Favorable
(in millions) 2009 December 31 October 29 December 31 (Unfavorable)
Interest expense $ (1,278) $ (705) $ (373) $ (1,078) $ (200)
Interest income 27 92 86 178 (151)
Loss on extinguishment of debt (83) — — — (83)
Miscellaneous, net 77 (114) (230) (344) 421
Total other expense, net $ (1,257) $ (727) $ (517) $ (1,244) $ (13)
Other expense, net for 2009 was $1.3 billion, compared to $1.2 billion for 2008 on a combined basis. This change is primarily attributable to (1) a
$200 million increase in interest expense from increased amortization of debt discount, (2) a $151 million decrease in interest income primarily from
significantly reduced short-term interest rates, (3) an $83 million non-cash loss for the write-off of the unamortized discount on the extinguishment of certain
Northwest debt and (4) a $421 million favorable change in miscellaneous, net due to the following:
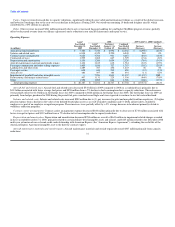
Favorable (Unfavorable)
2009 GAAP vs.
(in millions) 2008 Combined
Miscellaneous, net
Impairment in 2008 of minority ownership interest $ 213
Foreign currency exchange rates 99
Mark-to-market adjustments on the ineffective portion of fuel hedge contracts 77
Loss on investments in 2008 41
Other (9)
Total miscellaneous, net $ 421
32