Delta Airlines 2010 Annual Report Download - page 46
Download and view the complete annual report
Please find page 46 of the 2010 Delta Airlines annual report below. You can navigate through the pages in the report by either clicking on the pages listed below, or by using the keyword search tool below to find specific information within the annual report.-
 1
1 -
2
-
3
-
4
-
5
-
6
-
7
-
8
-
9
-
10
-
11
-
12
-
13
-
14
-
15
-
16
-
17
-
18
-
19
-
20
-
21
-
22
-
23
-
24
-
25
-
26
-
27
-
28
-
29
-
30
-
31
-
32
-
33
-
34
-
35
-
 36
36 -
 37
37 -
 38
38 -
 39
39 -
 40
40 -
 41
41 -
 42
42 -
 43
43 -
 44
44 -
 45
45 -
 46
46 -
 47
47 -
 48
48 -
 49
49 -
 50
50 -
 51
51 -
 52
52 -
 53
53 -
 54
54 -
 55
55 -
 56
56 -
57
-
58
-
59
-
60
-
61
-
62
-
63
-
64
-
65
-
66
-
67
-
68
-
69
-
70
-
71
-
72
-
73
-
74
-
75
-
76
-
77
-
78
-
79
-
80
-
81
-
82
-
83
-
84
-
85
-
86
-
87
-
88
-
89
-
90
-
91
-
92
-
93
-
94
-
95
-
96
-
97
-
98
-
99
-
100
-
101
-
102
-
103
-
104
-
105
-
106
-
107
-
108
-
109
-
110
-
111
-
112
-
113
-
114
-
115
-
116
-
117
-
118
-
119
-
120
-
121
-
122
-
123
-
124
-
125
-
126
-
127
-
128
-
129
-
130
-
131
-
132
-
133
-
134
-
135
-
136
-
137
-
138
-
139
-
140
-
141
-
142
-
143
-
144
-
145
-
146
-
147
-
148
-
149
-
150
-
151
-
152
-
153
-
154
-
155
-
156
-
157
-
158
-
159
-
160
-
161
-
162
-
163
-
164
-
165
-
166
-
167
-
168
-
169
-
170
-
171
-
172
-
173
-
174
-
175
-
176
-
177
-
178
-
179
-
180
-
181
-
182
-
183
-
184
-
185
-
186
-
187
-
188
-
189
-
190
-
191
-
192
-
193
-
194
-
195
-
196
-
197
-
198
-
199
-
200
-
201
-
202
-
203
-
204
-
205
-
206
-
207
-
208
-
209
-
210
-
211
-
212
-
213
-
214
-
215
-
216
-
217
-
218
-
219
-
220
-
221
-
222
-
223
-
224
-
225
-
226
-
227
-
228
-
229
-
230
-
231
-
232
-
233
-
234
-
235
-
236
-
237
-
238
-
239
-
240
-
241
-
242
-
243
-
244
-
245
-
246
-
247
-
248
-
249
-
250
-
251
-
252
-
253
-
254
-
255
-
256
-
257
-
258
-
259
-
260
-
261
-
262
-
263
-
264
-
265
-
266
-
267
-
268
-
269
-
270
-
271
-
272
-
273
-
274
-
275
-
276
-
277
-
278
-
279
-
280
-
281
-
282
-
283
-
284
-
285
-
286
-
287
-
288
-
289
-
290
-
291
-
292
-
293
-
294
-
295
-
296
-
297
-
298
-
299
-
300
-
301
-
302
-
303
-
304
-
305
-
306
-
307
-
308
-
309
-
310
-
311
-
312
-
313
-
314
-
315
-
316
-
317
-
318
-
319
-
320
-
321
-
322
-
323
-
324
-
325
-
326
-
327
-
328
-
329
-
330
-
331
-
332
-
333
-
334
-
335
-
336
-
337
-
338
-
339
-
340
-
341
-
342
-
343
-
344
-
345
-
346
-
347
-
348
-
349
-
350
-
351
-
352
-
353
-
354
-
355
-
356
-
357
-
358
-
359
-
360
-
361
-
362
-
363
-
364
-
365
-
366
-
367
-
368
-
369
-
370
-
371
-
372
-
373
-
374
-
375
-
376
-
377
-
378
-
379
-
380
-
381
-
382
-
383
-
384
-
385
-
386
-
387
-
388
-
389
-
390
-
391
-
392
-
393
-
394
-
395
-
396
-
397
-
398
-
399
-
400
-
401
-
402
-
403
-
404
-
405
-
406
-
407
-
408
-
409
-
410
-
411
-
412
-
413
-
414
-
415
-
416
-
417
-
418
-
419
-
420
-
421
-
422
-
423
-
424
-
425
-
426
-
427
-
428
-
429
-
430
-
431
-
432
-
433
-
434
-
435
-
436
-
437
-
438
-
439
-
440
-
441
-
442
-
443
-
444
-
445
-
446
-
447
 |
 |

Table of Contents
ITEM 7A. QUANTITATIVE AND QUALITATIVE DISCLOSURES ABOUT MARKET RISK
We have significant market risk exposure related to aircraft fuel prices, interest rates and foreign currency exchange rates. Market risk is the potential
negative impact of adverse changes in these prices or rates on our Consolidated Financial Statements. In an effort to manage our exposure to these risks, we
periodically enter into derivative transactions pursuant to stated policies. We expect adjustments to the fair value of financial instruments to result in ongoing
volatility in earnings and stockholders' equity.
The following sensitivity analysis does not consider the effects of a change in demand for air travel, the economy as a whole or actions we may take to
seek to mitigate our exposure to a particular risk. For these and other reasons, the actual results of changes in these prices or rates may differ materially from
the following hypothetical results.
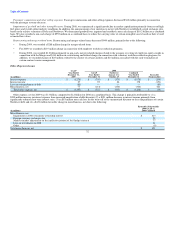
Fuel Price Risk
Our results of operations are materially impacted by changes in aircraft fuel prices. In an effort to manage our exposure to this risk, we periodically enter
into derivative instruments designated as cash flow hedges, which are comprised of crude oil, heating oil and jet fuel call option, collar and swap contracts, to
hedge a portion of our projected aircraft fuel requirements, including those of our Contract Carriers under capacity purchase agreements.
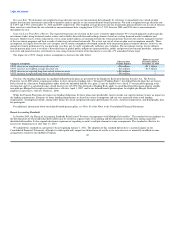
As of January 31, 2011, our open fuel hedge position is as follows:
Contract Fair
Value at
January 31,
Weighted Percentage of 2011
Average Contract Projected Based Upon
Strike Price Fuel Requirements $92 per Barrel of
(in millions, unless otherwise stated) per Gallon Hedged Crude Oil
Year ending December 31, 2011
Crude Oil
Call options $ 2.05 19% $ 239
Collars — cap/floor 2.10/1.78 10 84
Swaps 2.12 9 58
Total 38% $ 381
Year ending December 31, 2012
Crude Oil
Call Options $ 1.97 1% $ 29
Swaps 2.30 1 3
Total 2% $ 32
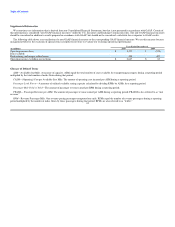
For 2010, aircraft fuel and related taxes, including our Contract Carriers under capacity purchase agreements, accounted for $8.9 billion, or 30%, of our
total operating expense, including $89 million of net fuel hedge costs. The following table shows the projected impact to aircraft fuel expense and fuel hedge
margin for 2011 based on the impact of our open fuel hedge contracts at January 31, 2011, assuming the following per barrel prices of crude oil:
Fuel Hedge
Year ending December 31, 2011 Margin
(Increase) Received from
Decrease to Hedge Gain (Posted to)
(in millions) Fuel Expense(1) (Loss)(2) Net impact Counterparties
$60 / barrel $ 2,786 $ (496) $ 2,290 $ (126)
$80 / barrel 1,054 (230) 824 4
$100 / barrel (677) 345 (332) 387
$120 / barrel (2,409) 996 (1,413) 999
(1) Projections based on the decrease (increase) to fuel expense as compared to the estimated crude oil price per barrel of $92 and estimated aircraft fuel
consumption of 3.6 billion gallons for the 11 months ending December 31, 2011.
(2) Projections based on average futures prices per gallon by contract settlement month.
42