Delta Airlines 2010 Annual Report Download - page 88
Download and view the complete annual report
Please find page 88 of the 2010 Delta Airlines annual report below. You can navigate through the pages in the report by either clicking on the pages listed below, or by using the keyword search tool below to find specific information within the annual report.-
 1
1 -
2
-
3
-
4
-
5
-
6
-
7
-
8
-
9
-
10
-
11
-
12
-
13
-
14
-
15
-
16
-
17
-
18
-
19
-
20
-
21
-
22
-
23
-
24
-
25
-
26
-
27
-
28
-
29
-
30
-
31
-
32
-
33
-
34
-
35
-
36
-
37
-
38
-
39
-
40
-
41
-
42
-
43
-
44
-
45
-
46
-
47
-
48
-
49
-
50
-
51
-
52
-
53
-
54
-
55
-
56
-
57
-
58
-
59
-
60
-
61
-
62
-
63
-
64
-
65
-
66
-
67
-
68
-
69
-
70
-
71
-
72
-
73
-
74
-
75
-
76
-
77
-
 78
78 -
 79
79 -
 80
80 -
 81
81 -
 82
82 -
 83
83 -
 84
84 -
 85
85 -
 86
86 -
 87
87 -
 88
88 -
 89
89 -
 90
90 -
 91
91 -
 92
92 -
 93
93 -
 94
94 -
 95
95 -
 96
96 -
 97
97 -
 98
98 -
99
-
100
-
101
-
102
-
103
-
104
-
105
-
106
-
107
-
108
-
109
-
110
-
111
-
112
-
113
-
114
-
115
-
116
-
117
-
118
-
119
-
120
-
121
-
122
-
123
-
124
-
125
-
126
-
127
-
128
-
129
-
130
-
131
-
132
-
133
-
134
-
135
-
136
-
137
-
138
-
139
-
140
-
141
-
142
-
143
-
144
-
145
-
146
-
147
-
148
-
149
-
150
-
151
-
152
-
153
-
154
-
155
-
156
-
157
-
158
-
159
-
160
-
161
-
162
-
163
-
164
-
165
-
166
-
167
-
168
-
169
-
170
-
171
-
172
-
173
-
174
-
175
-
176
-
177
-
178
-
179
-
180
-
181
-
182
-
183
-
184
-
185
-
186
-
187
-
188
-
189
-
190
-
191
-
192
-
193
-
194
-
195
-
196
-
197
-
198
-
199
-
200
-
201
-
202
-
203
-
204
-
205
-
206
-
207
-
208
-
209
-
210
-
211
-
212
-
213
-
214
-
215
-
216
-
217
-
218
-
219
-
220
-
221
-
222
-
223
-
224
-
225
-
226
-
227
-
228
-
229
-
230
-
231
-
232
-
233
-
234
-
235
-
236
-
237
-
238
-
239
-
240
-
241
-
242
-
243
-
244
-
245
-
246
-
247
-
248
-
249
-
250
-
251
-
252
-
253
-
254
-
255
-
256
-
257
-
258
-
259
-
260
-
261
-
262
-
263
-
264
-
265
-
266
-
267
-
268
-
269
-
270
-
271
-
272
-
273
-
274
-
275
-
276
-
277
-
278
-
279
-
280
-
281
-
282
-
283
-
284
-
285
-
286
-
287
-
288
-
289
-
290
-
291
-
292
-
293
-
294
-
295
-
296
-
297
-
298
-
299
-
300
-
301
-
302
-
303
-
304
-
305
-
306
-
307
-
308
-
309
-
310
-
311
-
312
-
313
-
314
-
315
-
316
-
317
-
318
-
319
-
320
-
321
-
322
-
323
-
324
-
325
-
326
-
327
-
328
-
329
-
330
-
331
-
332
-
333
-
334
-
335
-
336
-
337
-
338
-
339
-
340
-
341
-
342
-
343
-
344
-
345
-
346
-
347
-
348
-
349
-
350
-
351
-
352
-
353
-
354
-
355
-
356
-
357
-
358
-
359
-
360
-
361
-
362
-
363
-
364
-
365
-
366
-
367
-
368
-
369
-
370
-
371
-
372
-
373
-
374
-
375
-
376
-
377
-
378
-
379
-
380
-
381
-
382
-
383
-
384
-
385
-
386
-
387
-
388
-
389
-
390
-
391
-
392
-
393
-
394
-
395
-
396
-
397
-
398
-
399
-
400
-
401
-
402
-
403
-
404
-
405
-
406
-
407
-
408
-
409
-
410
-
411
-
412
-
413
-
414
-
415
-
416
-
417
-
418
-
419
-
420
-
421
-
422
-
423
-
424
-
425
-
426
-
427
-
428
-
429
-
430
-
431
-
432
-
433
-
434
-
435
-
436
-
437
-
438
-
439
-
440
-
441
-
442
-
443
-
444
-
445
-
446
-
447
 |
 |
Table of Contents
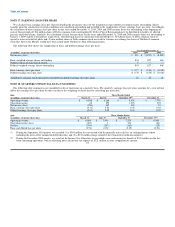
Estimated amounts that will be amortized from accumulated other comprehensive income into net periodic benefit cost in 2011 are an actuarial loss of
$55 million in pension benefits and an actuarial gain of $14 million relating to other postretirement and postemployment benefits. Amounts are generally
amortized into accumulated other comprehensive income over the expected future lifetime of plan participants.
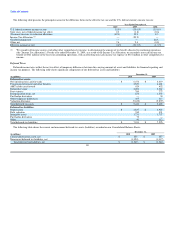
Net periodic cost included the following components:
Pension Other Postretirement and
Benefits Postemployment Benefits
Year Ended December 31, Year Ended December 31,
(in millions) 2010 2009 2008 2010 2009 2008
Service cost $ — $ — $ — $ 58 $ 53 $ 38
Interest cost 982 1,002 550 196 207 192
Expected return on plan assets (677) (615) (479) (90) (79) (151)
Amortization of prior service cost — — — (4) 18 —
Recognized net actuarial (gain) loss 48 33 — (4) (18) (6)
Settlement charge, net 14 9 3 — — —
Special termination benefits — — — — 6 —
Net periodic cost $ 367 $ 429 $ 74 $ 156 $ 187 $ 73
Defined contribution plan costs 334 306 211 — — —
Total cost $ 701 $ 735 $ 285 $ 156 $ 187 $ 73
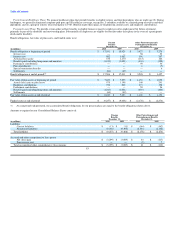
Assumptions. We used the following actuarial assumptions to determine our benefit obligations and our net periodic cost for the periods presented:
December 31,
Benefit Obligations(1)(2) 2010 2009
Weighted average discount rate 5.69% 5.93%
Assumed healthcare cost trend rate(3) 7.00% 7.50%
Year Ended December 31,
Net Periodic Benefit Cost(2)(4) 2010 2009 2008
Weighted average discount rate — pension benefit 5.93% 6.49% 7.19%
Weighted average discount rate — other postretirement benefit 5.75% 6.46% 6.46%
Weighted average discount rate — other postemployment benefit 5.88% 6.50% 6.95%
Weighted average expected long-term rate of return on plan assets 8.82% 8.83% 8.96%
Assumed healthcare cost trend rate(3) 7.50% 8.00% 8.00%
(1) Our 2010 and 2009 benefit obligations are measured using a mortality table projected to 2013.
(2) Future compensation levels do not impact our frozen defined benefit pension plans or other postretirement plans and impact only a small portion of our
other postemployment liability.
(3) The assumed healthcare cost trend rate at December 31, 2010 is assumed to decline gradually to 5.00% by 2019 and remain level thereafter.
(4) Our assumptions reflect various remeasurements of certain portions of our obligations and represent the weighted average of the assumptions used for
each measurement date.
84