Delta Airlines 2010 Annual Report Download - page 30
Download and view the complete annual report
Please find page 30 of the 2010 Delta Airlines annual report below. You can navigate through the pages in the report by either clicking on the pages listed below, or by using the keyword search tool below to find specific information within the annual report.-
 1
1 -
2
-
3
-
4
-
5
-
6
-
7
-
8
-
9
-
10
-
11
-
12
-
13
-
14
-
15
-
16
-
17
-
18
-
19
-
 20
20 -
 21
21 -
 22
22 -
 23
23 -
 24
24 -
 25
25 -
 26
26 -
 27
27 -
 28
28 -
 29
29 -
 30
30 -
 31
31 -
 32
32 -
 33
33 -
 34
34 -
 35
35 -
 36
36 -
 37
37 -
 38
38 -
 39
39 -
 40
40 -
41
-
42
-
43
-
44
-
45
-
46
-
47
-
48
-
49
-
50
-
51
-
52
-
53
-
54
-
55
-
56
-
57
-
58
-
59
-
60
-
61
-
62
-
63
-
64
-
65
-
66
-
67
-
68
-
69
-
70
-
71
-
72
-
73
-
74
-
75
-
76
-
77
-
78
-
79
-
80
-
81
-
82
-
83
-
84
-
85
-
86
-
87
-
88
-
89
-
90
-
91
-
92
-
93
-
94
-
95
-
96
-
97
-
98
-
99
-
100
-
101
-
102
-
103
-
104
-
105
-
106
-
107
-
108
-
109
-
110
-
111
-
112
-
113
-
114
-
115
-
116
-
117
-
118
-
119
-
120
-
121
-
122
-
123
-
124
-
125
-
126
-
127
-
128
-
129
-
130
-
131
-
132
-
133
-
134
-
135
-
136
-
137
-
138
-
139
-
140
-
141
-
142
-
143
-
144
-
145
-
146
-
147
-
148
-
149
-
150
-
151
-
152
-
153
-
154
-
155
-
156
-
157
-
158
-
159
-
160
-
161
-
162
-
163
-
164
-
165
-
166
-
167
-
168
-
169
-
170
-
171
-
172
-
173
-
174
-
175
-
176
-
177
-
178
-
179
-
180
-
181
-
182
-
183
-
184
-
185
-
186
-
187
-
188
-
189
-
190
-
191
-
192
-
193
-
194
-
195
-
196
-
197
-
198
-
199
-
200
-
201
-
202
-
203
-
204
-
205
-
206
-
207
-
208
-
209
-
210
-
211
-
212
-
213
-
214
-
215
-
216
-
217
-
218
-
219
-
220
-
221
-
222
-
223
-
224
-
225
-
226
-
227
-
228
-
229
-
230
-
231
-
232
-
233
-
234
-
235
-
236
-
237
-
238
-
239
-
240
-
241
-
242
-
243
-
244
-
245
-
246
-
247
-
248
-
249
-
250
-
251
-
252
-
253
-
254
-
255
-
256
-
257
-
258
-
259
-
260
-
261
-
262
-
263
-
264
-
265
-
266
-
267
-
268
-
269
-
270
-
271
-
272
-
273
-
274
-
275
-
276
-
277
-
278
-
279
-
280
-
281
-
282
-
283
-
284
-
285
-
286
-
287
-
288
-
289
-
290
-
291
-
292
-
293
-
294
-
295
-
296
-
297
-
298
-
299
-
300
-
301
-
302
-
303
-
304
-
305
-
306
-
307
-
308
-
309
-
310
-
311
-
312
-
313
-
314
-
315
-
316
-
317
-
318
-
319
-
320
-
321
-
322
-
323
-
324
-
325
-
326
-
327
-
328
-
329
-
330
-
331
-
332
-
333
-
334
-
335
-
336
-
337
-
338
-
339
-
340
-
341
-
342
-
343
-
344
-
345
-
346
-
347
-
348
-
349
-
350
-
351
-
352
-
353
-
354
-
355
-
356
-
357
-
358
-
359
-
360
-
361
-
362
-
363
-
364
-
365
-
366
-
367
-
368
-
369
-
370
-
371
-
372
-
373
-
374
-
375
-
376
-
377
-
378
-
379
-
380
-
381
-
382
-
383
-
384
-
385
-
386
-
387
-
388
-
389
-
390
-
391
-
392
-
393
-
394
-
395
-
396
-
397
-
398
-
399
-
400
-
401
-
402
-
403
-
404
-
405
-
406
-
407
-
408
-
409
-
410
-
411
-
412
-
413
-
414
-
415
-
416
-
417
-
418
-
419
-
420
-
421
-
422
-
423
-
424
-
425
-
426
-
427
-
428
-
429
-
430
-
431
-
432
-
433
-
434
-
435
-
436
-
437
-
438
-
439
-
440
-
441
-
442
-
443
-
444
-
445
-
446
-
447
 |
 |

Table of Contents
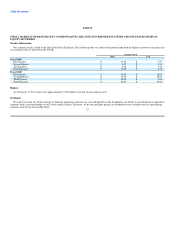
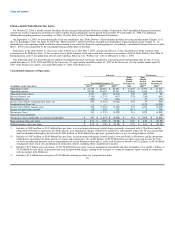
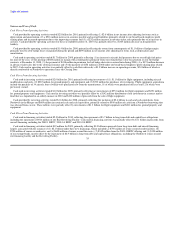
(5) Includes a $6.2 billion non-cash charge, or $31.58 diluted loss per share, for reorganization items, a $310 million non-cash charge, or $1.58 diluted loss
per share, associated with certain accounting adjustments and a $765 million income tax benefit, or $3.89 diluted earnings per share.
Other Financial and Statistical Data
(Unaudited)
Successor Predecessor
Eight Months Four Months
Ended Ended Year Ended
Year Ended December 31, December 31, April 30, December 31,
Consolidated(1) 2010 2009 2008 2007 2007 2006
Revenue passenger miles (millions) 193,169 188,943 134,879 85,029 37,036 116,133
Available seat miles (millions) 232,684 230,331 165,639 104,427 47,337 147,995
Passenger mile yield 14.11¢ 12.60¢ 14.52¢ 13.88¢ 13.84¢ 13.34¢
Passenger revenue per available seat mile 11.71¢ 10.34¢ 11.82¢ 11.30¢ 10.83¢ 10.47¢
Operating cost per available seat mile 12.69¢ 12.32¢ 18.72¢ 12.03¢ 11.61¢ 11.80¢
Passenger load factor 83.0% 82.0% 81.4% 81.4% 78.2% 78.5%
Fuel gallons consumed (millions) 3,823 3,853 2,740 1,742 792 2,480
Average price per fuel gallon, net of hedging $ 2.33 $ 2.15 $ 3.16 $ 2.38 $ 1.93 $ 2.12
Full-time equivalent employees, end of period 79,684 81,106 84,306 55,044 52,704 51,322
(1) Includes the operations of our contract carriers under capacity purchase agreements; full-time equivalent employees excludes employees of contract
carriers we do not own.
Successor Predecessor
December 31, December 31,
(in millions) 2010 2009 2008 2007 2006
Total assets $ 43,188 $ 43,789 $ 45,084 $ 32,423 $ 19,622
Long-term debt and capital leases (including current maturities) $ 15,252 $ 17,198 $ 16,571 $ 9,000 $ 8,012
Stockholders' equity (deficit) $ 897 $ 245 $ 874 $ 10,113 $ (13,593)
Common stock outstanding 835 784 695 292 197
26