Delta Airlines 2010 Annual Report Download - page 63
Download and view the complete annual report
Please find page 63 of the 2010 Delta Airlines annual report below. You can navigate through the pages in the report by either clicking on the pages listed below, or by using the keyword search tool below to find specific information within the annual report.-
 1
1 -
2
-
3
-
4
-
5
-
6
-
7
-
8
-
9
-
10
-
11
-
12
-
13
-
14
-
15
-
16
-
17
-
18
-
19
-
20
-
21
-
22
-
23
-
24
-
25
-
26
-
27
-
28
-
29
-
30
-
31
-
32
-
33
-
34
-
35
-
36
-
37
-
38
-
39
-
40
-
41
-
42
-
43
-
44
-
45
-
46
-
47
-
48
-
49
-
50
-
51
-
52
-
 53
53 -
 54
54 -
 55
55 -
 56
56 -
 57
57 -
 58
58 -
 59
59 -
 60
60 -
 61
61 -
 62
62 -
 63
63 -
 64
64 -
 65
65 -
 66
66 -
 67
67 -
 68
68 -
 69
69 -
 70
70 -
 71
71 -
 72
72 -
 73
73 -
74
-
75
-
76
-
77
-
78
-
79
-
80
-
81
-
82
-
83
-
84
-
85
-
86
-
87
-
88
-
89
-
90
-
91
-
92
-
93
-
94
-
95
-
96
-
97
-
98
-
99
-
100
-
101
-
102
-
103
-
104
-
105
-
106
-
107
-
108
-
109
-
110
-
111
-
112
-
113
-
114
-
115
-
116
-
117
-
118
-
119
-
120
-
121
-
122
-
123
-
124
-
125
-
126
-
127
-
128
-
129
-
130
-
131
-
132
-
133
-
134
-
135
-
136
-
137
-
138
-
139
-
140
-
141
-
142
-
143
-
144
-
145
-
146
-
147
-
148
-
149
-
150
-
151
-
152
-
153
-
154
-
155
-
156
-
157
-
158
-
159
-
160
-
161
-
162
-
163
-
164
-
165
-
166
-
167
-
168
-
169
-
170
-
171
-
172
-
173
-
174
-
175
-
176
-
177
-
178
-
179
-
180
-
181
-
182
-
183
-
184
-
185
-
186
-
187
-
188
-
189
-
190
-
191
-
192
-
193
-
194
-
195
-
196
-
197
-
198
-
199
-
200
-
201
-
202
-
203
-
204
-
205
-
206
-
207
-
208
-
209
-
210
-
211
-
212
-
213
-
214
-
215
-
216
-
217
-
218
-
219
-
220
-
221
-
222
-
223
-
224
-
225
-
226
-
227
-
228
-
229
-
230
-
231
-
232
-
233
-
234
-
235
-
236
-
237
-
238
-
239
-
240
-
241
-
242
-
243
-
244
-
245
-
246
-
247
-
248
-
249
-
250
-
251
-
252
-
253
-
254
-
255
-
256
-
257
-
258
-
259
-
260
-
261
-
262
-
263
-
264
-
265
-
266
-
267
-
268
-
269
-
270
-
271
-
272
-
273
-
274
-
275
-
276
-
277
-
278
-
279
-
280
-
281
-
282
-
283
-
284
-
285
-
286
-
287
-
288
-
289
-
290
-
291
-
292
-
293
-
294
-
295
-
296
-
297
-
298
-
299
-
300
-
301
-
302
-
303
-
304
-
305
-
306
-
307
-
308
-
309
-
310
-
311
-
312
-
313
-
314
-
315
-
316
-
317
-
318
-
319
-
320
-
321
-
322
-
323
-
324
-
325
-
326
-
327
-
328
-
329
-
330
-
331
-
332
-
333
-
334
-
335
-
336
-
337
-
338
-
339
-
340
-
341
-
342
-
343
-
344
-
345
-
346
-
347
-
348
-
349
-
350
-
351
-
352
-
353
-
354
-
355
-
356
-
357
-
358
-
359
-
360
-
361
-
362
-
363
-
364
-
365
-
366
-
367
-
368
-
369
-
370
-
371
-
372
-
373
-
374
-
375
-
376
-
377
-
378
-
379
-
380
-
381
-
382
-
383
-
384
-
385
-
386
-
387
-
388
-
389
-
390
-
391
-
392
-
393
-
394
-
395
-
396
-
397
-
398
-
399
-
400
-
401
-
402
-
403
-
404
-
405
-
406
-
407
-
408
-
409
-
410
-
411
-
412
-
413
-
414
-
415
-
416
-
417
-
418
-
419
-
420
-
421
-
422
-
423
-
424
-
425
-
426
-
427
-
428
-
429
-
430
-
431
-
432
-
433
-
434
-
435
-
436
-
437
-
438
-
439
-
440
-
441
-
442
-
443
-
444
-
445
-
446
-
447
 |
 |

Table of Contents
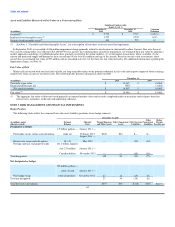
Cash Equivalents. Cash equivalents consist primarily of money market funds and treasury bills and are recorded in cash and cash equivalents on our
Consolidated Balance Sheets at cost, which approximates fair value.
Short-Term Investments. At December 31, 2010, short-term investments on our Consolidated Balance Sheet consist of treasury bills and are recorded at
cost, which approximates fair value.
During the year ended December 31, 2010, we received $77 million from an investment in a money market fund that was liquidated in an orderly manner,
$71 million of which was recorded in short-term investments on our Consolidated Balance Sheet at December 31, 2009. This investment was classified in
Level 3 of the three-tier fair value hierarchy due to uncertainty regarding the timing and expected amount of our distribution.
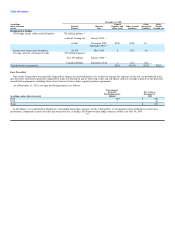
Restricted Cash Equivalents and Short-term Investments. Restricted investments consist primarily of money market funds and time deposits and are
recorded at cost, which approximates fair value. At December 31, 2010 and 2009, we recorded $407 million and $419 million, respectively, in restricted cash,
cash equivalents and short-term investments and $33 million and $16 million, respectively, in other noncurrent assets on our Consolidated Balance Sheets.
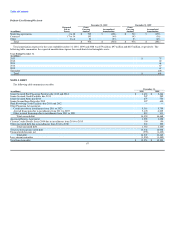
Long-Term Investments. Our long-term investments are comprised of student loan backed and insured auction rate securities, which are recorded at fair
value. At December 31, 2010 and 2009, the fair value of our auction rate securities was $119 million and $128 million, respectively. The cost of these
investments was $143 million and $155 million, respectively. These investments are classified as long-term in other noncurrent assets on our Consolidated
Balance Sheets due to the protracted failure in the auction process and long-term nature of these contractual maturities.
Because auction rate securities are not actively traded, fair values were estimated by discounting the cash flows expected to be received over the remaining
maturities of the underlying securities. We based the valuations on our assessment of observable yields on instruments bearing comparable risks and consider
the creditworthiness of the underlying debt issuer. Changes in market conditions could result in further adjustments to the fair value of these securities.
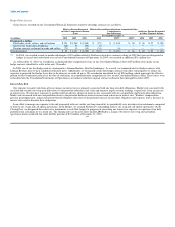
Hedge Derivatives. Our derivative instruments are comprised of contracts that are privately negotiated with counterparties without going through a public
exchange. Accordingly, our fair value assessments give consideration to the risk of counterparty default (as well as our own credit risk).
• Fuel Derivatives. Our fuel derivative instruments generally consist of crude oil, heating oil and jet fuel swap, collar, and call option contracts. Swap
contracts are valued under the income approach using a discounted cash flow model based on data either readily observable or derived from public
markets. Discount factors used in these valuations ranged from 0.996 to 0.999 based on interest rates applicable to the maturity dates of the
respective contracts. Option contracts are valued under the income approach using option pricing models based on data either readily observable in
public markets, derived from public markets or provided by counterparties who regularly trade in public markets. Volatilities used in these
valuations ranged from 16% to 34% depending on the maturity dates of the respective contracts.
• Interest Rate Derivatives. Our interest rate derivative instruments consist of swap and call option contracts and are valued primarily based on data
readily observable in public markets.
• Foreign Currency Derivatives. Our foreign currency derivative instruments consist of Japanese yen and Canadian dollar forward contracts and are
valued based on data readily observable in public markets.
For additional information regarding the classification of derivative instruments on our Consolidated Balance Sheets, see Note 3.
59