Delta Airlines 2010 Annual Report Download - page 39
Download and view the complete annual report
Please find page 39 of the 2010 Delta Airlines annual report below. You can navigate through the pages in the report by either clicking on the pages listed below, or by using the keyword search tool below to find specific information within the annual report.-
 1
1 -
2
-
3
-
4
-
5
-
6
-
7
-
8
-
9
-
10
-
11
-
12
-
13
-
14
-
15
-
16
-
17
-
18
-
19
-
20
-
21
-
22
-
23
-
24
-
25
-
26
-
27
-
28
-
 29
29 -
 30
30 -
 31
31 -
 32
32 -
 33
33 -
 34
34 -
 35
35 -
 36
36 -
 37
37 -
 38
38 -
 39
39 -
 40
40 -
 41
41 -
 42
42 -
 43
43 -
 44
44 -
 45
45 -
 46
46 -
 47
47 -
 48
48 -
 49
49 -
50
-
51
-
52
-
53
-
54
-
55
-
56
-
57
-
58
-
59
-
60
-
61
-
62
-
63
-
64
-
65
-
66
-
67
-
68
-
69
-
70
-
71
-
72
-
73
-
74
-
75
-
76
-
77
-
78
-
79
-
80
-
81
-
82
-
83
-
84
-
85
-
86
-
87
-
88
-
89
-
90
-
91
-
92
-
93
-
94
-
95
-
96
-
97
-
98
-
99
-
100
-
101
-
102
-
103
-
104
-
105
-
106
-
107
-
108
-
109
-
110
-
111
-
112
-
113
-
114
-
115
-
116
-
117
-
118
-
119
-
120
-
121
-
122
-
123
-
124
-
125
-
126
-
127
-
128
-
129
-
130
-
131
-
132
-
133
-
134
-
135
-
136
-
137
-
138
-
139
-
140
-
141
-
142
-
143
-
144
-
145
-
146
-
147
-
148
-
149
-
150
-
151
-
152
-
153
-
154
-
155
-
156
-
157
-
158
-
159
-
160
-
161
-
162
-
163
-
164
-
165
-
166
-
167
-
168
-
169
-
170
-
171
-
172
-
173
-
174
-
175
-
176
-
177
-
178
-
179
-
180
-
181
-
182
-
183
-
184
-
185
-
186
-
187
-
188
-
189
-
190
-
191
-
192
-
193
-
194
-
195
-
196
-
197
-
198
-
199
-
200
-
201
-
202
-
203
-
204
-
205
-
206
-
207
-
208
-
209
-
210
-
211
-
212
-
213
-
214
-
215
-
216
-
217
-
218
-
219
-
220
-
221
-
222
-
223
-
224
-
225
-
226
-
227
-
228
-
229
-
230
-
231
-
232
-
233
-
234
-
235
-
236
-
237
-
238
-
239
-
240
-
241
-
242
-
243
-
244
-
245
-
246
-
247
-
248
-
249
-
250
-
251
-
252
-
253
-
254
-
255
-
256
-
257
-
258
-
259
-
260
-
261
-
262
-
263
-
264
-
265
-
266
-
267
-
268
-
269
-
270
-
271
-
272
-
273
-
274
-
275
-
276
-
277
-
278
-
279
-
280
-
281
-
282
-
283
-
284
-
285
-
286
-
287
-
288
-
289
-
290
-
291
-
292
-
293
-
294
-
295
-
296
-
297
-
298
-
299
-
300
-
301
-
302
-
303
-
304
-
305
-
306
-
307
-
308
-
309
-
310
-
311
-
312
-
313
-
314
-
315
-
316
-
317
-
318
-
319
-
320
-
321
-
322
-
323
-
324
-
325
-
326
-
327
-
328
-
329
-
330
-
331
-
332
-
333
-
334
-
335
-
336
-
337
-
338
-
339
-
340
-
341
-
342
-
343
-
344
-
345
-
346
-
347
-
348
-
349
-
350
-
351
-
352
-
353
-
354
-
355
-
356
-
357
-
358
-
359
-
360
-
361
-
362
-
363
-
364
-
365
-
366
-
367
-
368
-
369
-
370
-
371
-
372
-
373
-
374
-
375
-
376
-
377
-
378
-
379
-
380
-
381
-
382
-
383
-
384
-
385
-
386
-
387
-
388
-
389
-
390
-
391
-
392
-
393
-
394
-
395
-
396
-
397
-
398
-
399
-
400
-
401
-
402
-
403
-
404
-
405
-
406
-
407
-
408
-
409
-
410
-
411
-
412
-
413
-
414
-
415
-
416
-
417
-
418
-
419
-
420
-
421
-
422
-
423
-
424
-
425
-
426
-
427
-
428
-
429
-
430
-
431
-
432
-
433
-
434
-
435
-
436
-
437
-
438
-
439
-
440
-
441
-
442
-
443
-
444
-
445
-
446
-
447
 |
 |

Table of Contents
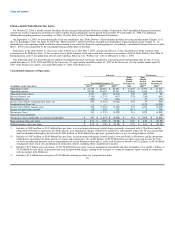
Sources and Uses of Cash
Cash Flows From Operating Activities
Cash provided by operating activities totaled $2.8 billion for 2010, primarily reflecting (1) $2.6 billion in net income after adjusting for items such as
depreciation and amortization, (2) a $516 million increase in accounts payable and accrued liabilities primarily related to our broad-based employee profit
sharing plans and increased operations due to the improving economy and (3) a $232 million increase in advance ticket sales primarily due to an increase in
air fares. Cash provided by operating activities for the year ended December 31, 2010 was partially offset by a $345 million decrease in frequent flyer
liability.
Cash provided by operating activities totaled $1.4 billion for 2009, primarily reflecting the return from counterparties of $1.1 billion of hedge margin
primarily used to settle hedge losses recognized during the period and $690 million in net income after adjusting for items such as depreciation and
amortization.
Cash used in operating activities totaled $1.7 billion for 2008, primarily reflecting (1) an increase in aircraft fuel payments due to record high fuel prices
for most of the year, (2) the posting of $680 million in margin with counterparties primarily from our estimated fair value loss position on our fuel hedge
contracts at December 31, 2008, (3) the payment of $438 million in premiums for fuel hedge derivatives entered into during 2008, (4) a $374 million decrease
in advance ticket sales due to the slowing economy and (5) the payment of $158 million in 2008 under our broad-based employee profit sharing plan related
to 2007. Cash used in operating activities was partially offset by cash flows driven by a $3.5 billion increase in operating revenue, $2.0 billion of which is
directly attributable to Northwest's operations since the Closing Date.
Cash Flows From Investing Activities
Cash used in investing activities totaled $2.0 billion for 2010, primarily reflecting investments of (1) $1.1 billion for flight equipment, including aircraft
modifications and parts, (2) $287 million for ground property and equipment and (3) $730 million for purchases of investments. Flight equipment acquisitions
include the purchase of 34 aircraft, four of which were purchased new from the manufacturer, 18 of which were purchased off lease and 12 of which were
previously owned.
Cash used in investing activities totaled $1.0 billion for 2009, primarily reflecting net investments of $951 million for flight equipment and $251 million
for ground property and equipment. Cash used in investing activities was partially offset by a $142 million distribution of our investment in a money market
fund that was liquidated in an orderly manner in 2010 and $100 million of proceeds from the sale of flight equipment.
Cash provided by investing activities totaled $1.6 billion for 2008, primarily reflecting the inclusion of $2.4 billion in cash and cash equivalents from
Northwest in the Merger and $609 million in restricted cash and cash equivalents, primarily related to $500 million of cash from a Northwest borrowing that
was released from escrow. These inflows were partially offset by investments of $1.3 billion for flight equipment and $241 million for ground property and
equipment.
Cash Flows From Financing Activities
Cash used in financing activities totaled $2.5 billion for 2010, reflecting the repayment of $3.7 billion in long-term debt and capital lease obligations,
including the repayment of $914 million of our Exit Revolving Facility. Cash used in financing activities was partially offset by $1.1 billion in proceeds from
aircraft financing, including the 2009-1 EETC, 2010-1A EETC and 2010-2A EETC.
Cash used in financing activities totaled $19 million for 2009, primarily reflecting $3.0 billion in proceeds from long-term debt and aircraft financing,
largely associated with the issuance of (1) $2.1 billion under three new financings, which included (a) $750 million of senior secured credit facilities, (b)
$750 million of senior secured notes, and (c) $600 million of senior second lien notes, (2) $342 million from the 2009-1 EETC offering and (3) $150 million
of tax exempt bonds, mostly offset by the repayment of $2.9 billion in long-term debt and capital lease obligations, including the Northwest senior secured
exit financing facility and the Revolving Facility.
35