Delta Airlines 2010 Annual Report Download - page 35
Download and view the complete annual report
Please find page 35 of the 2010 Delta Airlines annual report below. You can navigate through the pages in the report by either clicking on the pages listed below, or by using the keyword search tool below to find specific information within the annual report.-
 1
1 -
2
-
3
-
4
-
5
-
6
-
7
-
8
-
9
-
10
-
11
-
12
-
13
-
14
-
15
-
16
-
17
-
18
-
19
-
20
-
21
-
22
-
23
-
24
-
 25
25 -
 26
26 -
 27
27 -
 28
28 -
 29
29 -
 30
30 -
 31
31 -
 32
32 -
 33
33 -
 34
34 -
 35
35 -
 36
36 -
 37
37 -
 38
38 -
 39
39 -
 40
40 -
 41
41 -
 42
42 -
 43
43 -
 44
44 -
 45
45 -
46
-
47
-
48
-
49
-
50
-
51
-
52
-
53
-
54
-
55
-
56
-
57
-
58
-
59
-
60
-
61
-
62
-
63
-
64
-
65
-
66
-
67
-
68
-
69
-
70
-
71
-
72
-
73
-
74
-
75
-
76
-
77
-
78
-
79
-
80
-
81
-
82
-
83
-
84
-
85
-
86
-
87
-
88
-
89
-
90
-
91
-
92
-
93
-
94
-
95
-
96
-
97
-
98
-
99
-
100
-
101
-
102
-
103
-
104
-
105
-
106
-
107
-
108
-
109
-
110
-
111
-
112
-
113
-
114
-
115
-
116
-
117
-
118
-
119
-
120
-
121
-
122
-
123
-
124
-
125
-
126
-
127
-
128
-
129
-
130
-
131
-
132
-
133
-
134
-
135
-
136
-
137
-
138
-
139
-
140
-
141
-
142
-
143
-
144
-
145
-
146
-
147
-
148
-
149
-
150
-
151
-
152
-
153
-
154
-
155
-
156
-
157
-
158
-
159
-
160
-
161
-
162
-
163
-
164
-
165
-
166
-
167
-
168
-
169
-
170
-
171
-
172
-
173
-
174
-
175
-
176
-
177
-
178
-
179
-
180
-
181
-
182
-
183
-
184
-
185
-
186
-
187
-
188
-
189
-
190
-
191
-
192
-
193
-
194
-
195
-
196
-
197
-
198
-
199
-
200
-
201
-
202
-
203
-
204
-
205
-
206
-
207
-
208
-
209
-
210
-
211
-
212
-
213
-
214
-
215
-
216
-
217
-
218
-
219
-
220
-
221
-
222
-
223
-
224
-
225
-
226
-
227
-
228
-
229
-
230
-
231
-
232
-
233
-
234
-
235
-
236
-
237
-
238
-
239
-
240
-
241
-
242
-
243
-
244
-
245
-
246
-
247
-
248
-
249
-
250
-
251
-
252
-
253
-
254
-
255
-
256
-
257
-
258
-
259
-
260
-
261
-
262
-
263
-
264
-
265
-
266
-
267
-
268
-
269
-
270
-
271
-
272
-
273
-
274
-
275
-
276
-
277
-
278
-
279
-
280
-
281
-
282
-
283
-
284
-
285
-
286
-
287
-
288
-
289
-
290
-
291
-
292
-
293
-
294
-
295
-
296
-
297
-
298
-
299
-
300
-
301
-
302
-
303
-
304
-
305
-
306
-
307
-
308
-
309
-
310
-
311
-
312
-
313
-
314
-
315
-
316
-
317
-
318
-
319
-
320
-
321
-
322
-
323
-
324
-
325
-
326
-
327
-
328
-
329
-
330
-
331
-
332
-
333
-
334
-
335
-
336
-
337
-
338
-
339
-
340
-
341
-
342
-
343
-
344
-
345
-
346
-
347
-
348
-
349
-
350
-
351
-
352
-
353
-
354
-
355
-
356
-
357
-
358
-
359
-
360
-
361
-
362
-
363
-
364
-
365
-
366
-
367
-
368
-
369
-
370
-
371
-
372
-
373
-
374
-
375
-
376
-
377
-
378
-
379
-
380
-
381
-
382
-
383
-
384
-
385
-
386
-
387
-
388
-
389
-
390
-
391
-
392
-
393
-
394
-
395
-
396
-
397
-
398
-
399
-
400
-
401
-
402
-
403
-
404
-
405
-
406
-
407
-
408
-
409
-
410
-
411
-
412
-
413
-
414
-
415
-
416
-
417
-
418
-
419
-
420
-
421
-
422
-
423
-
424
-
425
-
426
-
427
-
428
-
429
-
430
-
431
-
432
-
433
-
434
-
435
-
436
-
437
-
438
-
439
-
440
-
441
-
442
-
443
-
444
-
445
-
446
-
447
 |
 |

Table of Contents
Cargo. Cargo revenue decreased due to capacity reductions, significantly reduced cargo yields and international volume as a result of the global recession,
and lower fuel surcharges due to the year-over-year decline in fuel prices. During 2009, we retired our remaining 10 dedicated freighter aircraft, which
contributed to a 40% decline in capacity.
Other. Other revenue increased $241 million primarily due to new or increased baggage handling fees and higher SkyMiles program revenue, partially
offset by decreased revenue from our alliance agreements and a reduction in our aircraft maintenance and repair service.
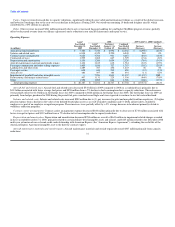
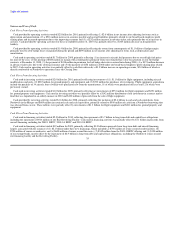
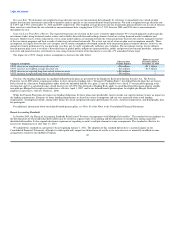
Operating Expense
GAAP 2008 2009 GAAP vs. 2008 Combined
Year Ended GAAP Northwest Combined %
December 31, Year Ended January 1 to Year Ended Increase Increase
(in millions) 2009 December 31 October 29 December 31 (Decrease) (Decrease)
Aircraft fuel and related taxes $ 7,384 $ 7,346 $ 4,996 $ 12,342 $ (4,958) (40)%
Salaries and related costs 6,838 4,329 2,220 6,549 289 4%
Contract carrier arrangements 3,823 3,766 901 4,667 (844) (18)%
Contracted services 1,595 1,062 667 1,729 (134) (8)%
Depreciation and amortization 1,536 1,266 1,054 2,320 (784) (34)%
Aircraft maintenance materials and outside repairs 1,434 1,169 612 1,781 (347) (19)%
Passenger commissions and other selling expenses 1,405 1,030 737 1,767 (362) (20)%
Landing fees and other rents 1,289 787 456 1,243 46 4%
Passenger service 638 440 210 650 (12) (2)%
Aircraft rent 480 307 184 491 (11) (2)%
Impairment of goodwill and other intangible assets — 7,296 3,841 11,137 (11,137) NM
Restructuring and merger-related items 407 1,131 225 1,356 (949) (70)%
Other 1,558 1,082 644 1,726 (168) (10)%
Total operating expense $ 28,387 $ 31,011 $ 16,747 $ 47,758 $ (19,371) (41)%
Aircraft fuel and related taxes. Aircraft fuel and related taxes decreased $5.0 billion in 2009 compared to 2008 on a combined basis primarily due to
$4.8 billion associated with lower average fuel prices and $858 million from a 7% decline in fuel consumption due to capacity reductions. These decreases
were partially offset by $1.4 billion in fuel hedge losses for 2009, compared to $666 million in fuel hedge losses for 2008. The fuel hedge losses in 2009 are
primarily from hedges purchased in 2008 during the period fuel prices reached record highs and were expected to continue to rise but instead declined.
Salaries and related costs. Salaries and related costs increased $289 million due to (1) pay increases for pilot and non-pilot frontline employees, (2) higher
pension expense from a decline in the value of our defined benefit plan assets as a result of market conditions and (3) Delta airline tickets awarded to
employees as part of an employee recognition program. These increases were partially offset by a 5% average decrease in headcount primarily related to
workforce reduction programs.
Contract carrier arrangements. Contract carrier arrangements expense decreased $844 million primarily due to decreases of $714 million associated with
lower average fuel prices and $119 million from a 7% decline in fuel consumption due to capacity reductions.
Depreciation and amortization. Depreciation and amortization decreased $784 million as a result of $641 million in impairment related charges recorded
in the year ended December 31, 2008, primarily related to certain definite-lived intangible assets and aircraft, and $125 million related to the December 2008
multi-year extension of our co-brand credit card relationship with American Express (the "American Express Agreement"), extending the useful life of the
American Express Agreement intangible asset to the date the contract expires.
Aircraft maintenance materials and outside repairs. Aircraft maintenance materials and outside repairs decreased $347 million primarily from capacity
reductions.
31