Delta Airlines 2010 Annual Report Download - page 43
Download and view the complete annual report
Please find page 43 of the 2010 Delta Airlines annual report below. You can navigate through the pages in the report by either clicking on the pages listed below, or by using the keyword search tool below to find specific information within the annual report.-
 1
1 -
2
-
3
-
4
-
5
-
6
-
7
-
8
-
9
-
10
-
11
-
12
-
13
-
14
-
15
-
16
-
17
-
18
-
19
-
20
-
21
-
22
-
23
-
24
-
25
-
26
-
27
-
28
-
29
-
30
-
31
-
32
-
 33
33 -
 34
34 -
 35
35 -
 36
36 -
 37
37 -
 38
38 -
 39
39 -
 40
40 -
 41
41 -
 42
42 -
 43
43 -
 44
44 -
 45
45 -
 46
46 -
 47
47 -
 48
48 -
 49
49 -
 50
50 -
 51
51 -
 52
52 -
 53
53 -
54
-
55
-
56
-
57
-
58
-
59
-
60
-
61
-
62
-
63
-
64
-
65
-
66
-
67
-
68
-
69
-
70
-
71
-
72
-
73
-
74
-
75
-
76
-
77
-
78
-
79
-
80
-
81
-
82
-
83
-
84
-
85
-
86
-
87
-
88
-
89
-
90
-
91
-
92
-
93
-
94
-
95
-
96
-
97
-
98
-
99
-
100
-
101
-
102
-
103
-
104
-
105
-
106
-
107
-
108
-
109
-
110
-
111
-
112
-
113
-
114
-
115
-
116
-
117
-
118
-
119
-
120
-
121
-
122
-
123
-
124
-
125
-
126
-
127
-
128
-
129
-
130
-
131
-
132
-
133
-
134
-
135
-
136
-
137
-
138
-
139
-
140
-
141
-
142
-
143
-
144
-
145
-
146
-
147
-
148
-
149
-
150
-
151
-
152
-
153
-
154
-
155
-
156
-
157
-
158
-
159
-
160
-
161
-
162
-
163
-
164
-
165
-
166
-
167
-
168
-
169
-
170
-
171
-
172
-
173
-
174
-
175
-
176
-
177
-
178
-
179
-
180
-
181
-
182
-
183
-
184
-
185
-
186
-
187
-
188
-
189
-
190
-
191
-
192
-
193
-
194
-
195
-
196
-
197
-
198
-
199
-
200
-
201
-
202
-
203
-
204
-
205
-
206
-
207
-
208
-
209
-
210
-
211
-
212
-
213
-
214
-
215
-
216
-
217
-
218
-
219
-
220
-
221
-
222
-
223
-
224
-
225
-
226
-
227
-
228
-
229
-
230
-
231
-
232
-
233
-
234
-
235
-
236
-
237
-
238
-
239
-
240
-
241
-
242
-
243
-
244
-
245
-
246
-
247
-
248
-
249
-
250
-
251
-
252
-
253
-
254
-
255
-
256
-
257
-
258
-
259
-
260
-
261
-
262
-
263
-
264
-
265
-
266
-
267
-
268
-
269
-
270
-
271
-
272
-
273
-
274
-
275
-
276
-
277
-
278
-
279
-
280
-
281
-
282
-
283
-
284
-
285
-
286
-
287
-
288
-
289
-
290
-
291
-
292
-
293
-
294
-
295
-
296
-
297
-
298
-
299
-
300
-
301
-
302
-
303
-
304
-
305
-
306
-
307
-
308
-
309
-
310
-
311
-
312
-
313
-
314
-
315
-
316
-
317
-
318
-
319
-
320
-
321
-
322
-
323
-
324
-
325
-
326
-
327
-
328
-
329
-
330
-
331
-
332
-
333
-
334
-
335
-
336
-
337
-
338
-
339
-
340
-
341
-
342
-
343
-
344
-
345
-
346
-
347
-
348
-
349
-
350
-
351
-
352
-
353
-
354
-
355
-
356
-
357
-
358
-
359
-
360
-
361
-
362
-
363
-
364
-
365
-
366
-
367
-
368
-
369
-
370
-
371
-
372
-
373
-
374
-
375
-
376
-
377
-
378
-
379
-
380
-
381
-
382
-
383
-
384
-
385
-
386
-
387
-
388
-
389
-
390
-
391
-
392
-
393
-
394
-
395
-
396
-
397
-
398
-
399
-
400
-
401
-
402
-
403
-
404
-
405
-
406
-
407
-
408
-
409
-
410
-
411
-
412
-
413
-
414
-
415
-
416
-
417
-
418
-
419
-
420
-
421
-
422
-
423
-
424
-
425
-
426
-
427
-
428
-
429
-
430
-
431
-
432
-
433
-
434
-
435
-
436
-
437
-
438
-
439
-
440
-
441
-
442
-
443
-
444
-
445
-
446
-
447
 |
 |

Table of Contents
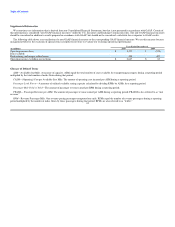
Long-Lived Assets
Our flight equipment and other long-lived assets have a recorded value of $20.3 billion on our Consolidated Balance Sheet at December 31, 2010. This
value is based on various factors, including the assets' estimated useful lives and salvage values. We record impairment losses on flight equipment and other
long-lived assets used in operations when events and circumstances indicate the assets may be impaired and the estimated future cash flows generated by
those assets are less than their carrying amounts. Factors which could cause impairment include, but are not limited to, (1) deciding to permanently remove
flight equipment or other long-lived assets from operations, (2) significant changes in the estimated useful life, (3) operational downsizing, (4) significant
changes in the projected cash flows, (5) permanent and significant declines in fleet fair values and (6) changes to the regulatory environment. For long-lived
assets held for sale, we record impairment losses when the carrying amount is greater than the fair value less the cost to sell. We discontinue depreciation of
long-lived assets when these assets are classified as held for sale.
To determine whether impairments exist for aircraft used in operations, we group assets at the fleet-type level (the lowest level for which there are
identifiable cash flows) and then estimate future cash flows based on projections of capacity, passenger mile yield, fuel costs, labor costs and other relevant
factors. If an impairment occurs, the impairment loss recognized is the amount by which the aircraft's carrying amount exceeds its estimated fair value. We
estimate aircraft fair values using published sources, appraisals and bids received from third parties, as available. For additional information, see Note 1 of the
Notes to the Consolidated Financial Statements.
Income Tax Valuation Allowance and Contingencies
We periodically assess whether it is more likely than not that we will generate sufficient taxable income to realize our deferred income tax assets and
establish valuation allowances if it is not likely we will realize our deferred income tax assets. In making this determination, we consider all available positive
and negative evidence and make certain assumptions. We consider, among other things, our deferred tax liabilities, the overall business environment, our
historical financial results, our industry's historically cyclical financial results and potential, current and future tax planning strategies. We cannot presently
determine when we will be able to generate sufficient taxable income to realize our deferred tax assets. Accordingly, we have recorded a full valuation
allowance against our net deferred tax assets.
Our income tax provisions are based on calculations and assumptions that are subject to examination by the Internal Revenue Service and other taxing
authorities. Although the positions we have taken on previously filed tax returns are reasonable, we have established tax and interest reserves in recognition
that taxing authorities may challenge these positions, which could result in additional liabilities for taxes and interest. We review and adjust the reserves as
circumstances warrant and events occur, such as lapsing of applicable statutes of limitations, conclusion of tax audits, a change in exposure based on current
calculations, identification of new issues, release of administrative guidance or the rendering of a court decision affecting a particular issue. We adjust the
income tax provision in the period in which the facts that give rise to the revision become known. For additional information about income taxes, see Notes 1
and 9 of the Notes to the Consolidated Financial Statements.
Defined Benefit Pension Plans
We sponsor defined benefit pension plans for our eligible employees and retirees. These plans are closed to new entrants and frozen for future benefit
accruals. As of December 31, 2010, the unfunded benefit obligation for these plans recorded on our Consolidated Balance Sheet was $9.3 billion. During
2010, we contributed $728 million to these plans and recorded $367 million of expense in salaries and related costs on our Consolidated Statement of
Operations. In 2011, we estimate we will contribute approximately $600 million to these plans and that our expense will be approximately $300 million. The
most critical assumptions impacting our defined benefit pension plan obligations and expenses are the weighted average discount rate and the expected long-
term rate of return on the assets.
39