Delta Airlines 2002 Annual Report Download - page 179
Download and view the complete annual report
Please find page 179 of the 2002 Delta Airlines annual report below. You can navigate through the pages in the report by either clicking on the pages listed below, or by using the keyword search tool below to find specific information within the annual report.-
 1
1 -
2
-
3
-
4
-
5
-
6
-
7
-
8
-
9
-
10
-
11
-
12
-
13
-
14
-
15
-
16
-
17
-
18
-
19
-
20
-
21
-
22
-
23
-
24
-
25
-
26
-
27
-
28
-
29
-
30
-
31
-
32
-
33
-
34
-
35
-
36
-
37
-
38
-
39
-
40
-
41
-
42
-
43
-
44
-
45
-
46
-
47
-
48
-
49
-
50
-
51
-
52
-
53
-
54
-
55
-
56
-
57
-
58
-
59
-
60
-
61
-
62
-
63
-
64
-
65
-
66
-
67
-
68
-
69
-
70
-
71
-
72
-
73
-
74
-
75
-
76
-
77
-
78
-
79
-
80
-
81
-
82
-
83
-
84
-
85
-
86
-
87
-
88
-
89
-
90
-
91
-
92
-
93
-
94
-
95
-
96
-
97
-
98
-
99
-
100
-
101
-
102
-
103
-
104
-
105
-
106
-
107
-
108
-
109
-
110
-
111
-
112
-
113
-
114
-
115
-
116
-
117
-
118
-
119
-
120
-
121
-
122
-
123
-
124
-
125
-
126
-
127
-
128
-
129
-
130
-
131
-
132
-
133
-
134
-
135
-
136
-
137
-
138
-
139
-
140
-
141
-
142
-
143
-
144
-
145
-
146
-
147
-
148
-
149
-
150
-
151
-
152
-
153
-
154
-
155
-
156
-
157
-
158
-
159
-
160
-
161
-
162
-
163
-
164
-
165
-
166
-
167
-
168
-
 169
169 -
 170
170 -
 171
171 -
 172
172 -
 173
173 -
 174
174 -
 175
175 -
 176
176 -
 177
177 -
 178
178 -
 179
179 -
 180
180 -
 181
181 -
 182
182 -
 183
183 -
 184
184 -
 185
185 -
 186
186 -
 187
187 -
 188
188 -
 189
189 -
190
-
191
-
192
-
193
-
194
-
195
-
196
-
197
-
198
-
199
-
200
 |
 |
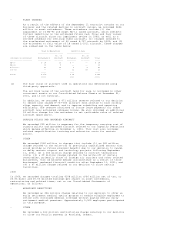
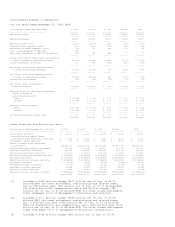
Consolidated Summary of Operations
For the years ended December 31, 2002-1998
(in millions, except per share data) 2002(1) 2001(2) 2000(3) 1999(4) 1998
----------------------------------- -------- -------- -------- -------- --------
Operating revenues $ 13,305 $ 13,879 $ 16,741 $ 14,883 $ 14,312
-------- -------- -------- -------- --------
Operating expenses 14,614 15,481 15,104 13,565 12,509
-------- -------- -------- -------- --------
Operating income (loss) (1,309) (1,602) 1,637 1,318 1,803
Interest income (expense), net(5) (610) (410) (257) (126) (66)
Miscellaneous income (expense), net(6) (2) 80 328 901 39
Loss on extinguishment of ESOP Notes (42) -- -- -- --
Fair value adjustments of SFAS 133 derivatives (39) 68 (159) -- --
-------- -------- -------- -------- --------
Income (loss) before income taxes and cumulative
effect of change in accounting principle (2,002) (1,864) 1,549 2,093 1,776
Income tax benefit (provision) 730 648 (621) (831) (698)
-------- -------- -------- -------- --------
Net income (loss) before cumulative effect
of change in accounting principle (1,272) (1,216) 928 1,262 1,078
-------- -------- -------- -------- --------
Net income (loss) after cumulative effect
of change in accounting principle (1,272) (1,216) 828 1,208 1,078
Preferred stock dividends (15) (14) (13) (12) (11)
-------- -------- -------- -------- --------
Net income (loss) attributable to
common shareowners $ (1,287) $ (1,230) $ 815 $ 1,196 $ 1,067
-------- -------- -------- -------- --------
Earnings (loss) per share before cumulative
effect of change in
accounting principle(7)
Basic $ (10.44) $ (9.99) $ 7.39 $ 9.05 $ 7.22
Diluted $ (10.44) $ (9.99) $ 7.05 $ 8.52 $ 6.87
-------- -------- -------- -------- --------
Earnings (loss) per share(7)
Basic $ (10.44) $ (9.99) $ 6.58 $ 8.66 $ 7.22
Diluted $ (10.44) (9.99) $ 6.28 $ 8.15 $ 6.87
-------- -------- -------- -------- --------
Dividends declared per common share $ 0.10 $ 0.10 $ 0.10 $ 0.10 $ 0.10
======== ======== ======== ======== ========
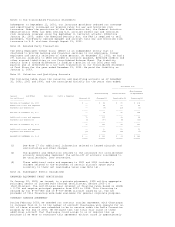
Other Financial and Statistical Data
For the years ended December 31, 2002-1998 2002(1) 2001(2) 2000(3) 1999(4) 1998
------------------------------------------- ------------ ------------ ------------ ------------ ------------
Total assets (millions) $ 24,720 $ 23,605 $ 21,931 $ 19,942 $ 14,727
Long-term debt and capital leases
(excluding current maturities) (millions) $ 10,174 $ 8,347 $ 5,896 $ 4,303 $ 1,720
Shareowners' equity (millions) $ 893 $ 3,769 $ 5,343 $ 4,908 $ 4,077
Shares of common stock outstanding
at year end(7) 123,359,205 123,245,666 123,013,372 132,893,470 141,514,262
Revenue passengers enplaned (thousands) 107,048 104,943 119,930 110,083 105,304
Available seat miles (millions) 141,719 147,837 154,974 147,073 142,154
Revenue passenger miles (millions) 102,029 101,717 112,998 106,165 103,342
Operating revenue per available seat mile 9.39(cents) 9.39(cents) 10.80(cents) 10.12(cents) 10.07(cents)
Passenger mile yield 12.08(cents) 12.74(cents) 13.86(cents) 13.14(cents) 12.99(cents)
Operating cost per available seat mile 10.31(cents) 10.47(cents) 9.75(cents) 9.22(cents) 8.80(cents)
Passenger load factor 71.99% 68.80% 72.91% 72.18% 72.70%
Breakeven passenger load factor 79.64% 77.31% 65.29% 65.37% 62.94%
Available ton miles (millions) 21,548 22,282 22,925 21,245 20,312
Revenue ton miles (millions) 11,698 11,752 13,058 12,227 12,052
Operating cost per available ton miles 67.82(cents) 69.48(cents) 65.88(cents) 63.85(cents) 61.58(cents)
============ ============ ============ ============ =============
(1) Includes a $439 million charge ($277 million net of tax, or $2.25
diluted EPS) for asset writedowns, restructuring and related items,
net; a $34 million gain ($22 million net of tax, or $0.17 diluted EPS)
for Stabilization Act compensation; and a $94 million charge ($59
million net of tax, or $0.47 diluted EPS) for other income and expense
items (seepages 16-17 of Management's Discussion and Analysis).
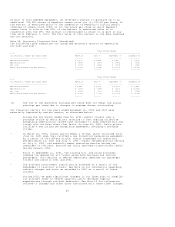
(2) Includes a $1.1 billion charge ($695 million net of tax, or $5.63
diluted EPS) for asset writedowns, restructuring and related items,
net; a $634 million gain ($392 million net of tax, or $3.18 diluted
EPS) for Stabilization Act compensation; and a $186 million gain ($114
million net of tax, or $0.92 diluted EPS) for other income and expense
items (see pages 16-17 of Management's Discussion and Analysis).
(3) Includes a $108 million charge ($66 million net of tax, or $0.50