Delta Airlines 2002 Annual Report Download - page 172
Download and view the complete annual report
Please find page 172 of the 2002 Delta Airlines annual report below. You can navigate through the pages in the report by either clicking on the pages listed below, or by using the keyword search tool below to find specific information within the annual report.-
 1
1 -
2
-
3
-
4
-
5
-
6
-
7
-
8
-
9
-
10
-
11
-
12
-
13
-
14
-
15
-
16
-
17
-
18
-
19
-
20
-
21
-
22
-
23
-
24
-
25
-
26
-
27
-
28
-
29
-
30
-
31
-
32
-
33
-
34
-
35
-
36
-
37
-
38
-
39
-
40
-
41
-
42
-
43
-
44
-
45
-
46
-
47
-
48
-
49
-
50
-
51
-
52
-
53
-
54
-
55
-
56
-
57
-
58
-
59
-
60
-
61
-
62
-
63
-
64
-
65
-
66
-
67
-
68
-
69
-
70
-
71
-
72
-
73
-
74
-
75
-
76
-
77
-
78
-
79
-
80
-
81
-
82
-
83
-
84
-
85
-
86
-
87
-
88
-
89
-
90
-
91
-
92
-
93
-
94
-
95
-
96
-
97
-
98
-
99
-
100
-
101
-
102
-
103
-
104
-
105
-
106
-
107
-
108
-
109
-
110
-
111
-
112
-
113
-
114
-
115
-
116
-
117
-
118
-
119
-
120
-
121
-
122
-
123
-
124
-
125
-
126
-
127
-
128
-
129
-
130
-
131
-
132
-
133
-
134
-
135
-
136
-
137
-
138
-
139
-
140
-
141
-
142
-
143
-
144
-
145
-
146
-
147
-
148
-
149
-
150
-
151
-
152
-
153
-
154
-
155
-
156
-
157
-
158
-
159
-
160
-
161
-
 162
162 -
 163
163 -
 164
164 -
 165
165 -
 166
166 -
 167
167 -
 168
168 -
 169
169 -
 170
170 -
 171
171 -
 172
172 -
 173
173 -
 174
174 -
 175
175 -
 176
176 -
 177
177 -
 178
178 -
 179
179 -
 180
180 -
 181
181 -
 182
182 -
183
-
184
-
185
-
186
-
187
-
188
-
189
-
190
-
191
-
192
-
193
-
194
-
195
-
196
-
197
-
198
-
199
-
200
 |
 |
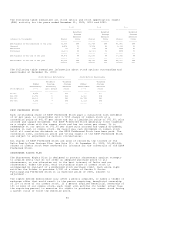
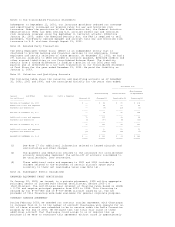
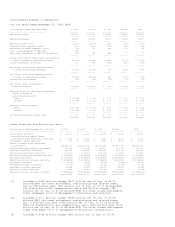
Note 18. Earnings (Loss) per Share
We calculate basic earnings (loss) per share by dividing the income (loss)
available to common shareowners by the weighted average number of common shares
outstanding. Diluted earnings (loss) per share includes the dilutive effects of
stock options and convertible securities. To the extent stock options and
convertible securities are anti-dilutive, they are excluded from the calculation
of diluted earnings (loss) per share. The following table shows our computation
of basic and diluted earnings (loss) per share:
Years Ended December 31,
(in millions, except per share data) 2002 2001 2000
------------------------------------ -------- -------- ------
BASIC:
Net income (loss) excluding cumulative effect of change in
accounting principle $ (1,272) $ (1,216) $ 928
Dividends on allocated Series B ESOP
Convertible Preferred Stock (15) (14) (13)
-------- -------- ------
Net income (loss) available to common shareowners, excluding
cumulative effect of change in accounting principle $ (1,287) $ (1,230) $ 915
Weighted average shares outstanding 123.3 123.1 123.8
-------- -------- ------
Basic earnings (loss) per share excluding cumulative
effect of change in accounting principle $ (10.44) $ (9.99) $ 7.39
======== ======== ======
DILUTED:
Net income (loss) available to common shareowners, excluding
cumulative effect of change in accounting principle $ (1,287) $ (1,230) $ 915
Income tax effect assuming conversion of allocated Series B ESOP
Convertible Preferred Stock -- -- 8
-------- -------- ------
Income (loss) available to common shareowners including
assumed conversion $ (1,287) $ (1,230) $ 923
Weighted average shares outstanding 123.3 123.1 123.8
Additional shares assuming:
Exercise of stock options -- -- 1.6
Conversion of allocated Series B ESOP Convertible Preferred Stock -- -- 5.4
Conversion of performance-based stock units -- -- 0.2
-------- -------- ------
Weighted average shares outstanding, as adjusted 123.3 123.1 131.0
-------- -------- ------
Diluted earnings (loss) per share excluding cumulative
effect of change in accounting principle $ (10.44) $ (9.99) $ 7.05
======== ======== ======
For the years ended December 31, 2002, 2001 and 2000, we excluded from the
diluted earnings (loss) per share computation (1) 54.5 million, 44.3 million and
23.4 million stock options, respectively, because the exercise price of the
options was greater than the average price of common stock and (2) 6.9 million,
6.5 million and zero additional shares, respectively, because their effect on
earnings (loss) per share was anti-dilutive.
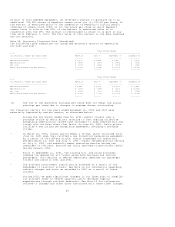
Note 19. Stabilization Act
On September 22, 2001, the Air Transportation Safety and System Stabilization
Act (Stabilization Act) became effective. The Stabilization Act is intended to
preserve the viability of the U.S. air transportation system following the
terrorist attacks on September 11, 2001 by, among other things, (1) providing
for payments from the U.S. Government totaling $5 billion to compensate U.S. air
carriers for losses incurred from September 11, 2001 through December 31, 2001
as a result of the September 11 terrorist attacks and (2) permitting the
Secretary of Transportation to sell insurance to U.S. air carriers.
Our allocated portion of compensation under the Stabilization Act was $668
million. Due to uncertainties regarding the U.S. government's calculation of
compensation, we recognized $634 million of this amount in our 2001 Consolidated
Statement of Operations. We recognized the remaining $34 million of compensation
in our 2002 Consolidated Statement of Operations. We received $112 million and
$556 million in cash for the years ended December 31, 2002 and 2001,
respectively, under the Stabilization Act.
63