Delta Airlines 2002 Annual Report Download - page 135
Download and view the complete annual report
Please find page 135 of the 2002 Delta Airlines annual report below. You can navigate through the pages in the report by either clicking on the pages listed below, or by using the keyword search tool below to find specific information within the annual report.-
 1
1 -
2
-
3
-
4
-
5
-
6
-
7
-
8
-
9
-
10
-
11
-
12
-
13
-
14
-
15
-
16
-
17
-
18
-
19
-
20
-
21
-
22
-
23
-
24
-
25
-
26
-
27
-
28
-
29
-
30
-
31
-
32
-
33
-
34
-
35
-
36
-
37
-
38
-
39
-
40
-
41
-
42
-
43
-
44
-
45
-
46
-
47
-
48
-
49
-
50
-
51
-
52
-
53
-
54
-
55
-
56
-
57
-
58
-
59
-
60
-
61
-
62
-
63
-
64
-
65
-
66
-
67
-
68
-
69
-
70
-
71
-
72
-
73
-
74
-
75
-
76
-
77
-
78
-
79
-
80
-
81
-
82
-
83
-
84
-
85
-
86
-
87
-
88
-
89
-
90
-
91
-
92
-
93
-
94
-
95
-
96
-
97
-
98
-
99
-
100
-
101
-
102
-
103
-
104
-
105
-
106
-
107
-
108
-
109
-
110
-
111
-
112
-
113
-
114
-
115
-
116
-
117
-
118
-
119
-
120
-
121
-
122
-
123
-
124
-
 125
125 -
 126
126 -
 127
127 -
 128
128 -
 129
129 -
 130
130 -
 131
131 -
 132
132 -
 133
133 -
 134
134 -
 135
135 -
 136
136 -
 137
137 -
 138
138 -
 139
139 -
 140
140 -
 141
141 -
 142
142 -
 143
143 -
 144
144 -
 145
145 -
146
-
147
-
148
-
149
-
150
-
151
-
152
-
153
-
154
-
155
-
156
-
157
-
158
-
159
-
160
-
161
-
162
-
163
-
164
-
165
-
166
-
167
-
168
-
169
-
170
-
171
-
172
-
173
-
174
-
175
-
176
-
177
-
178
-
179
-
180
-
181
-
182
-
183
-
184
-
185
-
186
-
187
-
188
-
189
-
190
-
191
-
192
-
193
-
194
-
195
-
196
-
197
-
198
-
199
-
200
 |
 |
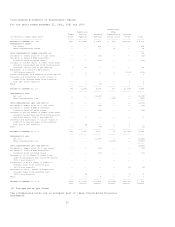
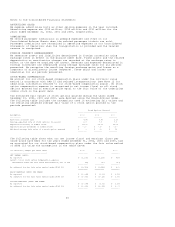
Consolidated Statements of Shareowners' Equity
For the years ended December 31, 2002, 2001 and 2000
Accumulated
Additional Other
Common Paid-in Retained Comprehensive Treasury
(in millions, except share data) Stock Capital Earnings Income (Loss) Stock Total
------------------------------- ------ ---------- -------- ------------- -------- -------
BALANCE AT DECEMBER 31, 1999 $270 $ 3,222 $ 3,377 $ 266 $(2,227) $ 4,908
COMPREHENSIVE INCOME:
Net income -- -- 828 -- -- 828
Other comprehensive income -- -- -- 94 -- 94
-------
TOTAL COMPREHENSIVE INCOME (SEE NOTE 14) 922
Dividends on common stock ($0.10) per share) -- -- (12) -- -- (12)
Dividends on Series B ESOP Convertible
Preferred Stock allocated shares -- -- (13) -- -- (13)
Issuance of 729,426 shares of common stock under
dividend reinvestment and stock purchase plan
and stock options ($44.86 per share(1)) 1 32 -- -- -- 33
Repurchase of 10,626,104 common shares
($47.26 per share(1)) -- -- -- -- (502) (502)
Income tax benefit from exercise of stock options -- 5 -- -- -- 5
Transfers and forfeitures of 16,580 shares of
common from Treasury under stock incentive
plan ($52.61 per share(1)) -- -- -- -- 1 1
Other -- 5 (4) -- -- 1
---- ------- ------- ------- ------- -------
BALANCE AT DECEMBER 31, 2000 271 3,264 4,176 360 (2,728) 5,343
---- ------- ------- ------- ------- -------
COMPREHENSIVE LOSS:
Net loss -- -- (1,216) -- -- (1,216)
Other comprehensive loss -- -- -- (335) -- (335)
-------
TOTAL COMPREHENSIVE LOSS (SEE NOTE 14) -- -- -- -- -- (1,551)
Dividends on common stock ($0.10 per share) -- -- (12) -- -- (12)
Dividends on Series B ESOP Convertible
Preferred Stock allocated shares -- -- (14) -- -- (14)
Issuance of 126,299 shares of common stock under
dividend reinvestment and stock purchase plan
and stock options ($38.10 per share(1)) -- 5 -- -- -- 5
Transfers and forfeitures of 105,995 shares of
common from Treasury under stock incentive
plan ($37.10 per share(1)) -- (4) -- -- 4 --
Other -- 2 (4) -- -- (2)
---- ------- ------- ------- ------- -------
BALANCE AT DECEMBER 31, 2001 271 3,267 2,930 25 (2,724) 3,769
---- ------- ------- ------- ------- -------
COMPREHENSIVE LOSS:
Net loss -- -- (1,272) -- -- (1,272)
Other comprehensive loss -- -- -- (1,587) -- (1,587)
-------
TOTAL COMPREHENSIVE LOSS (SEE NOTE 14) (2,859)
Dividends on common stock ($0.10 per share) -- -- (12) -- -- (12)
Dividends on Series B ESOP Convertible
Preferred Stock allocated shares -- -- (15) -- -- (15)
Issuance of 13,017 shares of common stock
under stock purchase plan and stock options
($15.70 per share(1)) -- -- -- -- -- --
Forfeitures of 82,878 shares of common to
Treasury under stock incentive plan
($27.31 per share(1)) -- -- -- -- (2) (2)
Transfers of 183,400 shares of common from
Treasury under stock incentive plan
($47.11 per share(1)) -- (5) -- -- 8 3
Other -- 1 8 -- -- 9
---- ------- ------- ------- ------- -------
BALANCE AT DECEMBER 31, 2002 $271 $ 3,263 $ 1,639 $(1,562) $(2,718) $ 893
==== ======= ======= ======= ======= =======
(1) Average price per share
The accompanying notes are an integral part of these Consolidated Financial
Statements.
30