Delta Airlines 2002 Annual Report Download - page 141
Download and view the complete annual report
Please find page 141 of the 2002 Delta Airlines annual report below. You can navigate through the pages in the report by either clicking on the pages listed below, or by using the keyword search tool below to find specific information within the annual report.-
 1
1 -
2
-
3
-
4
-
5
-
6
-
7
-
8
-
9
-
10
-
11
-
12
-
13
-
14
-
15
-
16
-
17
-
18
-
19
-
20
-
21
-
22
-
23
-
24
-
25
-
26
-
27
-
28
-
29
-
30
-
31
-
32
-
33
-
34
-
35
-
36
-
37
-
38
-
39
-
40
-
41
-
42
-
43
-
44
-
45
-
46
-
47
-
48
-
49
-
50
-
51
-
52
-
53
-
54
-
55
-
56
-
57
-
58
-
59
-
60
-
61
-
62
-
63
-
64
-
65
-
66
-
67
-
68
-
69
-
70
-
71
-
72
-
73
-
74
-
75
-
76
-
77
-
78
-
79
-
80
-
81
-
82
-
83
-
84
-
85
-
86
-
87
-
88
-
89
-
90
-
91
-
92
-
93
-
94
-
95
-
96
-
97
-
98
-
99
-
100
-
101
-
102
-
103
-
104
-
105
-
106
-
107
-
108
-
109
-
110
-
111
-
112
-
113
-
114
-
115
-
116
-
117
-
118
-
119
-
120
-
121
-
122
-
123
-
124
-
125
-
126
-
127
-
128
-
129
-
130
-
 131
131 -
 132
132 -
 133
133 -
 134
134 -
 135
135 -
 136
136 -
 137
137 -
 138
138 -
 139
139 -
 140
140 -
 141
141 -
 142
142 -
 143
143 -
 144
144 -
 145
145 -
 146
146 -
 147
147 -
 148
148 -
 149
149 -
 150
150 -
 151
151 -
152
-
153
-
154
-
155
-
156
-
157
-
158
-
159
-
160
-
161
-
162
-
163
-
164
-
165
-
166
-
167
-
168
-
169
-
170
-
171
-
172
-
173
-
174
-
175
-
176
-
177
-
178
-
179
-
180
-
181
-
182
-
183
-
184
-
185
-
186
-
187
-
188
-
189
-
190
-
191
-
192
-
193
-
194
-
195
-
196
-
197
-
198
-
199
-
200
 |
 |
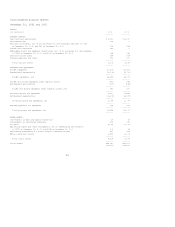
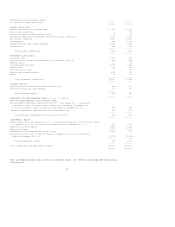
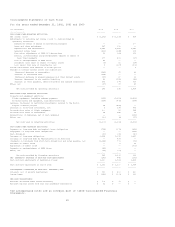
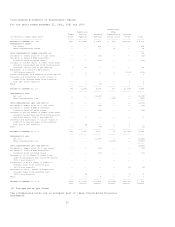
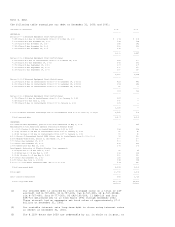
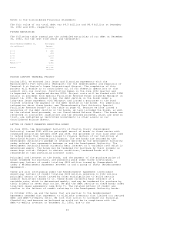
Notes to the Consolidated Financial Statements
ADVERTISING COSTS
We expense advertising costs as other selling expenses in the year incurred.
Advertising expense was $130 million, $153 million and $151 million for the
years ended December 31, 2002, 2001 and 2000, respectively.
COMMISSIONS
We record passenger commissions in prepaid expenses and other on our
Consolidated Balance Sheets when the related passenger tickets are sold.
Passenger commissions are recognized in operating expenses on our Consolidated
Statements of Operations when the transportation is provided and the related
revenue is recognized.
FOREIGN CURRENCY REMEASUREMENT
We remeasure assets and liabilities denominated in foreign currencies using
exchange rates in effect on the balance sheet date. Fixed assets and the related
depreciation or amortization charges are recorded at the exchange rates in
effect on the date we acquired the assets. Revenues and expenses denominated in
foreign currencies are remeasured using average exchange rates for all periods
presented. We recognize the resulting foreign exchange gains and losses as a
component of miscellaneous income (expense). These gains and losses are
immaterial for all periods presented.
STOCK-BASED COMPENSATION
We account for our stock-based compensation plans under the intrinsic value
method in accordance with APB 25 and related interpretations (see Note 12 for
additional information related to our stock-based compensation plans). No stock
option compensation expense is recognized in net income (loss) as all stock
options granted had an exercise price equal to the fair value of the underlying
common stock on the grant date.
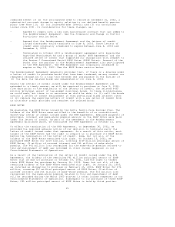
The estimated fair values of stock options granted during the years ended
December 31, 2002, 2001 and 2000, were derived using the Black-Scholes model.
The following table includes the assumptions used in estimating fair values and
the resulting weighted average fair value of a stock option granted in the
periods presented:
Stock Options Granted
--------------------------------------
Assumption 2002 2001 2000
---------- -------- -------- --------
Risk-free interest rate 4.4% 5.8% 6.2%
Average expected life of stock options (in years) 6.7 7.5 7.5
Expected volatility of common stock 38.9% 26.9% 26.9%
Expected annual dividends on common stock $ 0.10 $ 0.10 $ 0.10
Weighted average fair value of a stock option granted $ 9 $ 20 $ 23
-------- -------- --------
The following table shows what our net income (loss) and earnings (loss) per
share would have been for the years ended December 31, 2002, 2001 and 2000, had
we accounted for our stock-based compensation plans under the fair value method
of SFAS 123 using the assumptions in the table above:
(in millions, except per share data) 2002 2001 2000
------------------------------------ --------- --------- --------
NET INCOME (LOSS):
As reported $ (1,272) $ (1,216) $ 828
Deduct: total stock option compensation expense
determined under the fair value based method, net of tax (47) (30) (27)
--------- --------- --------
As adjusted for the fair value method under SFAS 123 $ (1,319) $ (1,246) $ 801
========= ========= ========
BASIC EARNINGS (LOSS) PER SHARE:
As reported $ (10.44) $ (9.99) $ 6.58
As adjusted for the fair value method under SFAS 123 $ (10.82) $ (10.23) $ 6.36
--------- --------- --------
DILUTED EARNINGS (LOSS) PER SHARE:
As reported $ (10.44) $ (9.99) $ 6.28
As adjusted for the fair value method under SFAS 123 $ (10.82) $ (10.23) $ 6.07
--------- --------- --------
36