Delta Airlines 2002 Annual Report Download - page 129
Download and view the complete annual report
Please find page 129 of the 2002 Delta Airlines annual report below. You can navigate through the pages in the report by either clicking on the pages listed below, or by using the keyword search tool below to find specific information within the annual report.-
 1
1 -
2
-
3
-
4
-
5
-
6
-
7
-
8
-
9
-
10
-
11
-
12
-
13
-
14
-
15
-
16
-
17
-
18
-
19
-
20
-
21
-
22
-
23
-
24
-
25
-
26
-
27
-
28
-
29
-
30
-
31
-
32
-
33
-
34
-
35
-
36
-
37
-
38
-
39
-
40
-
41
-
42
-
43
-
44
-
45
-
46
-
47
-
48
-
49
-
50
-
51
-
52
-
53
-
54
-
55
-
56
-
57
-
58
-
59
-
60
-
61
-
62
-
63
-
64
-
65
-
66
-
67
-
68
-
69
-
70
-
71
-
72
-
73
-
74
-
75
-
76
-
77
-
78
-
79
-
80
-
81
-
82
-
83
-
84
-
85
-
86
-
87
-
88
-
89
-
90
-
91
-
92
-
93
-
94
-
95
-
96
-
97
-
98
-
99
-
100
-
101
-
102
-
103
-
104
-
105
-
106
-
107
-
108
-
109
-
110
-
111
-
112
-
113
-
114
-
115
-
116
-
117
-
118
-
 119
119 -
 120
120 -
 121
121 -
 122
122 -
 123
123 -
 124
124 -
 125
125 -
 126
126 -
 127
127 -
 128
128 -
 129
129 -
 130
130 -
 131
131 -
 132
132 -
 133
133 -
 134
134 -
 135
135 -
 136
136 -
 137
137 -
 138
138 -
 139
139 -
140
-
141
-
142
-
143
-
144
-
145
-
146
-
147
-
148
-
149
-
150
-
151
-
152
-
153
-
154
-
155
-
156
-
157
-
158
-
159
-
160
-
161
-
162
-
163
-
164
-
165
-
166
-
167
-
168
-
169
-
170
-
171
-
172
-
173
-
174
-
175
-
176
-
177
-
178
-
179
-
180
-
181
-
182
-
183
-
184
-
185
-
186
-
187
-
188
-
189
-
190
-
191
-
192
-
193
-
194
-
195
-
196
-
197
-
198
-
199
-
200
 |
 |
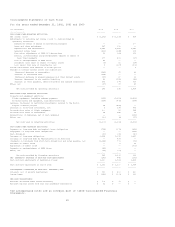
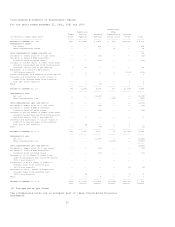
Management's Discussion and Analysis of Financial Condition and Results of
Operations
The fair values of our heating and crude oil derivative instruments were $73
million at December 31, 2002 and $64 million at December 31, 2001. A 10%
decrease in the average annual price of heating and crude oil would have
decreased the fair values of these instruments by $70 million at December
31, 2002.
During 2002, aircraft fuel accounted for 12% of our total operating expenses.
Based on our projected aircraft fuel consumption of 2.4 billion gallons for
2003, a 10% rise in our jet fuel prices would increase our aircraft fuel expense
by approximately $46 million in 2003. This analysis includes the effects of fuel
hedging instruments in place at December 31, 2002.
For additional information regarding our aircraft fuel price risk management
program, see Note 4 of the Notes to the Consolidated Financial Statements.
EQUITY SECURITIES RISK
We hold equity-based interests, including warrants and other similar rights, in
certain companies, primarily priceline and Republic Airways Holdings, Inc.
(Republic). The estimated fair values and aggregate unrealized and unrecognized
losses from these investments were $31 million and $9 million, respectively, at
December 31, 2002. At December 31, 2001, the estimated fair values of our
equity-based interests totaled $81 million, with aggregate unrealized and
unrecognized losses of $3 million. The risk associated with these investments is
the potential loss in fair value resulting from a decrease in the price of the
issuer's common stock. Based on the fair value of these equity-based interests
at December 31, 2002, a 10% decline in the price of the underlying common stock
would decrease the fair value of these instruments by approximately $3 million.
For additional information regarding our equity-based interests, see Note 2 of
the Notes to the Consolidated Financial Statements.
INTEREST RATE RISK
Our exposure to market risk due to changes in interest rates primarily relates
to our long-term debt obligations and cash investment portfolio.
Market risk associated with our long-term debt is the potential change in fair
value resulting from a change in interest rates. A 10% decrease in average
annual interest rates would have increased the estimated fair value of our
long-term debt by approximately $395 million at December 31, 2002, and $373
million at December 31, 2001. To manage our interest rate exposure, we have
entered into two interest rate swap agreements. At December 31, 2002, the fair
value of these agreements was $21 million. A 10% increase in average annual
interest rates would have had an immaterial effect on the fair value of these
instruments at December 31, 2002. A 10% increase in average annual interest
rates would have had an approximately $17 million impact on our interest expense
in 2002. For additional information on our interest rate swap and long-term debt
agreements, see Notes 4 and 6 of the Notes to the Consolidated Financial
Statements.
Market risk associated with our cash portfolio is the potential change in
earnings resulting from a change in interest rates. Based on our average balance
of cash and cash equivalents during 2002, a 10% decrease in average annual
interest rates would have decreased our interest income by approximately $4
million.
FOREIGN CURRENCY EXCHANGE RATE RISK
We have limited revenues and expenses denominated in foreign currencies. As a
result, we are exposed to limited foreign currency exchange rate risk. The
majority of our exposure results from transactions denominated in the euro,
British pound and Canadian dollar. To manage exchange rate risk, we net foreign
currency revenues and expenses, to the extent practicable, to take advantage of
natural offsets. We may use foreign currency option and forward contracts with
maturities of up to 12 months to manage the remaining net exposure. We did not
have any of these instruments outstanding at December 31, 2002. Based on our
average annual net foreign currency positions during 2002, a 10% adverse change
in average annual foreign currency exchange rates would not have had a material
impact on our Consolidated Financial Statements.
24