Delta Airlines 2002 Annual Report Download - page 166
Download and view the complete annual report
Please find page 166 of the 2002 Delta Airlines annual report below. You can navigate through the pages in the report by either clicking on the pages listed below, or by using the keyword search tool below to find specific information within the annual report.-
 1
1 -
2
-
3
-
4
-
5
-
6
-
7
-
8
-
9
-
10
-
11
-
12
-
13
-
14
-
15
-
16
-
17
-
18
-
19
-
20
-
21
-
22
-
23
-
24
-
25
-
26
-
27
-
28
-
29
-
30
-
31
-
32
-
33
-
34
-
35
-
36
-
37
-
38
-
39
-
40
-
41
-
42
-
43
-
44
-
45
-
46
-
47
-
48
-
49
-
50
-
51
-
52
-
53
-
54
-
55
-
56
-
57
-
58
-
59
-
60
-
61
-
62
-
63
-
64
-
65
-
66
-
67
-
68
-
69
-
70
-
71
-
72
-
73
-
74
-
75
-
76
-
77
-
78
-
79
-
80
-
81
-
82
-
83
-
84
-
85
-
86
-
87
-
88
-
89
-
90
-
91
-
92
-
93
-
94
-
95
-
96
-
97
-
98
-
99
-
100
-
101
-
102
-
103
-
104
-
105
-
106
-
107
-
108
-
109
-
110
-
111
-
112
-
113
-
114
-
115
-
116
-
117
-
118
-
119
-
120
-
121
-
122
-
123
-
124
-
125
-
126
-
127
-
128
-
129
-
130
-
131
-
132
-
133
-
134
-
135
-
136
-
137
-
138
-
139
-
140
-
141
-
142
-
143
-
144
-
145
-
146
-
147
-
148
-
149
-
150
-
151
-
152
-
153
-
154
-
155
-
 156
156 -
 157
157 -
 158
158 -
 159
159 -
 160
160 -
 161
161 -
 162
162 -
 163
163 -
 164
164 -
 165
165 -
 166
166 -
 167
167 -
 168
168 -
 169
169 -
 170
170 -
 171
171 -
 172
172 -
 173
173 -
 174
174 -
 175
175 -
 176
176 -
177
-
178
-
179
-
180
-
181
-
182
-
183
-
184
-
185
-
186
-
187
-
188
-
189
-
190
-
191
-
192
-
193
-
194
-
195
-
196
-
197
-
198
-
199
-
200
 |
 |
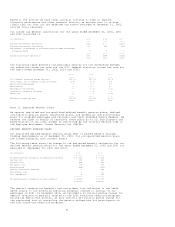
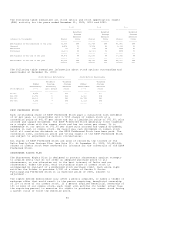
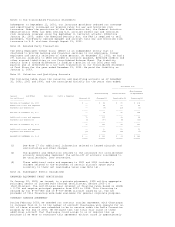
Operating revenues are assigned to a specific geographic region based on the
origin, flight path and destination of each flight segment. Our operating
revenues by geographic region for the years ended December 31, 2002, 2001 and
2000, are summarized in the following table:
(in millions) 2002 2001 2000
------------- --------- --------- ---------
North America $ 10,778 $ 11,288 $ 14,004
Atlantic 1,860 1,823 1,988
Pacific 127 222 297
Latin America 540 546 452
--------- --------- ---------
Total $ 13,305 $ 13,879 $ 16,741
========= ========= =========
Our tangible assets consist primarily of flight equipment which is mobile across
geographic markets. Accordingly, assets are not allocated to specific geographic
regions.
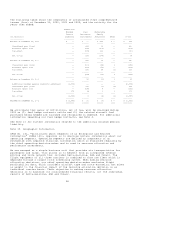
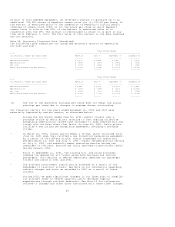
Note 16. Asset Writedowns, Restructuring and Related Items, Net
2002
In 2002, we recorded net charges totaling $439 million ($277 million net of tax,
or $2.25 diluted earnings per share) in asset writedowns, restructuring and
related items, net on our Consolidated Statements of Operations, as follows:
- FLEET CHANGES
During 2002, we made significant changes in our fleet plan (1) to
reduce costs through fleet simplification and capacity reductions and
(2) to decrease capital expenditures through aircraft deferrals. These
actions resulted in $225 million in net asset impairments and other
charges, which are discussed below.
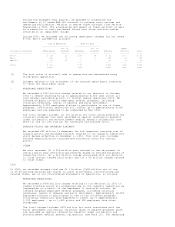
During the September 2002 quarter, we recorded an impairment charge,
shown in the table below, related to 59 owned B-727 aircraft. The
impairment of 23 B-727 aircraft used in operations resulted from a
further reduction in their estimated future cash flows and fair values
since our impairment review in 2001. The impairment of 36 B-727
aircraft held for sale resulted from a further decline in their fair
values less the cost to sell since our impairment review in 2001. The
aircraft held for sale will be disposed of as part of our fleet
simplification plan and are expected to be sold by December 31, 2003,
under an existing agreement. The net book value of these aircraft held
for sale is included in other noncurrent assets on our Consolidated
Balance Sheets at December 31, 2002, and is not material; these
aircraft are not included in the aircraft fleet table on page 70
because they have been removed from service.
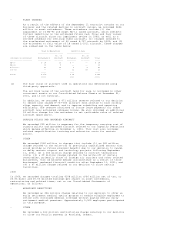
During the September 2002 quarter, we also decided to temporarily
remove our MD-11 aircraft from service beginning in early 2003. As a
result of this decision, we recorded an impairment charge, shown in the
table below, related to our eight owned MD-11 aircraft. This charge
reflects the further reduction in estimated future cash flows and fair
values of these aircraft since our impairment review in 2001. The MD-11
aircraft will be replaced on international routes by B-767-300ER
aircraft that are currently used in the domestic system. We will use
smaller mainline aircraft to replace the B-767 aircraft on domestic
routes, thereby reducing our domestic capacity.
During the December 2002 quarter, we decided to return to service,
beginning in 2003, nine leased B-737-300 aircraft to replace the B-767
aircraft on domestic routes. This decision was based on (1) capacity
and operating cost considerations and (2) our inability to sublease the
B-737-300 aircraft due to the difficult business environment facing the
airline industry after September 11, 2001. As discussed below, during
the June 2001 quarter, we decided to remove the B-737-300 aircraft from
service and recorded a reserve for future lease payments less estimated
sublease income. Due to our decision to return these aircraft to
service, we reversed the remaining $56 million reserve related to these
B-737-300 aircraft.
During the December 2002 quarter, we entered into an agreement with
Boeing to defer 31 mainline aircraft previously scheduled for delivery
in 2003 and 2004. As a result of these deferrals, we have no mainline
aircraft scheduled for delivery during 2003 or 2004. We incurred a $30
million charge related to these deferrals.
59