Delta Airlines 2002 Annual Report Download - page 105
Download and view the complete annual report
Please find page 105 of the 2002 Delta Airlines annual report below. You can navigate through the pages in the report by either clicking on the pages listed below, or by using the keyword search tool below to find specific information within the annual report.-
 1
1 -
2
-
3
-
4
-
5
-
6
-
7
-
8
-
9
-
10
-
11
-
12
-
13
-
14
-
15
-
16
-
17
-
18
-
19
-
20
-
21
-
22
-
23
-
24
-
25
-
26
-
27
-
28
-
29
-
30
-
31
-
32
-
33
-
34
-
35
-
36
-
37
-
38
-
39
-
40
-
41
-
42
-
43
-
44
-
45
-
46
-
47
-
48
-
49
-
50
-
51
-
52
-
53
-
54
-
55
-
56
-
57
-
58
-
59
-
60
-
61
-
62
-
63
-
64
-
65
-
66
-
67
-
68
-
69
-
70
-
71
-
72
-
73
-
74
-
75
-
76
-
77
-
78
-
79
-
80
-
81
-
82
-
83
-
84
-
85
-
86
-
87
-
88
-
89
-
90
-
91
-
92
-
93
-
94
-
 95
95 -
 96
96 -
 97
97 -
 98
98 -
 99
99 -
 100
100 -
 101
101 -
 102
102 -
 103
103 -
 104
104 -
 105
105 -
 106
106 -
 107
107 -
 108
108 -
 109
109 -
 110
110 -
 111
111 -
 112
112 -
 113
113 -
 114
114 -
 115
115 -
116
-
117
-
118
-
119
-
120
-
121
-
122
-
123
-
124
-
125
-
126
-
127
-
128
-
129
-
130
-
131
-
132
-
133
-
134
-
135
-
136
-
137
-
138
-
139
-
140
-
141
-
142
-
143
-
144
-
145
-
146
-
147
-
148
-
149
-
150
-
151
-
152
-
153
-
154
-
155
-
156
-
157
-
158
-
159
-
160
-
161
-
162
-
163
-
164
-
165
-
166
-
167
-
168
-
169
-
170
-
171
-
172
-
173
-
174
-
175
-
176
-
177
-
178
-
179
-
180
-
181
-
182
-
183
-
184
-
185
-
186
-
187
-
188
-
189
-
190
-
191
-
192
-
193
-
194
-
195
-
196
-
197
-
198
-
199
-
200
 |
 |
.
.
.
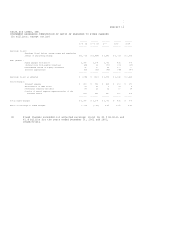
EXHIBIT 12
DELTA AIR LINES, INC.
STATEMENT REGARDING COMPUTATION OF RATIO OF EARNINGS TO FIXED CHARGES
(In millions, except ratios)
------- ------- ------- ------- -------
2002 (1) 2001 (1) 2000 1999 1998
------- ------- ------- ------- -------
Earnings (loss):
Earnings (loss) before income taxes and cumulative
effect of accounting change $(2,002) $(1,864) $ 1,549 $ 2,093 $ 1,776
Add (deduct):
Fixed charges from below 1,340 1,204 1,079 831 703
(Income)/loss from equity investees (41) 12 (59) (30) (15)
Distributed income of equity investees 40 70 32 100 --
Interest capitalized (15) (32) (45) (48) (40)
------- ------- ------- ------- -------
Earnings (loss) as adjusted $ (678) $ (610) $ 2,556 $ 2,946 $ 2,424
Fixed charges:
Interest expense $ 660 $ 531 $ 426 $ 250 $ 179
Amortization of debt costs 19 12 1 11 3
Preference security dividend 24 22 22 20 18
Portion of rental expense representative of the
interest factor 637 639 630 550 503
------- ------- ------- ------- -------
Total fixed charges $ 1,340 $ 1,204 $ 1,079 $ 831 $ 703
Ratio of earnings to fixed charges (0.51) (0.51) 2.37 3.55 3.45
(1) Fixed charges exceeded our adjusted earnings (loss) by $2.0 billion and
$1.8 billion for the years ended December 31, 2002 and 2001,
respectively.