Delta Airlines 2002 Annual Report Download - page 117
Download and view the complete annual report
Please find page 117 of the 2002 Delta Airlines annual report below. You can navigate through the pages in the report by either clicking on the pages listed below, or by using the keyword search tool below to find specific information within the annual report.-
 1
1 -
2
-
3
-
4
-
5
-
6
-
7
-
8
-
9
-
10
-
11
-
12
-
13
-
14
-
15
-
16
-
17
-
18
-
19
-
20
-
21
-
22
-
23
-
24
-
25
-
26
-
27
-
28
-
29
-
30
-
31
-
32
-
33
-
34
-
35
-
36
-
37
-
38
-
39
-
40
-
41
-
42
-
43
-
44
-
45
-
46
-
47
-
48
-
49
-
50
-
51
-
52
-
53
-
54
-
55
-
56
-
57
-
58
-
59
-
60
-
61
-
62
-
63
-
64
-
65
-
66
-
67
-
68
-
69
-
70
-
71
-
72
-
73
-
74
-
75
-
76
-
77
-
78
-
79
-
80
-
81
-
82
-
83
-
84
-
85
-
86
-
87
-
88
-
89
-
90
-
91
-
92
-
93
-
94
-
95
-
96
-
97
-
98
-
99
-
100
-
101
-
102
-
103
-
104
-
105
-
106
-
 107
107 -
 108
108 -
 109
109 -
 110
110 -
 111
111 -
 112
112 -
 113
113 -
 114
114 -
 115
115 -
 116
116 -
 117
117 -
 118
118 -
 119
119 -
 120
120 -
 121
121 -
 122
122 -
 123
123 -
 124
124 -
 125
125 -
 126
126 -
 127
127 -
128
-
129
-
130
-
131
-
132
-
133
-
134
-
135
-
136
-
137
-
138
-
139
-
140
-
141
-
142
-
143
-
144
-
145
-
146
-
147
-
148
-
149
-
150
-
151
-
152
-
153
-
154
-
155
-
156
-
157
-
158
-
159
-
160
-
161
-
162
-
163
-
164
-
165
-
166
-
167
-
168
-
169
-
170
-
171
-
172
-
173
-
174
-
175
-
176
-
177
-
178
-
179
-
180
-
181
-
182
-
183
-
184
-
185
-
186
-
187
-
188
-
189
-
190
-
191
-
192
-
193
-
194
-
195
-
196
-
197
-
198
-
199
-
200
 |
 |
Management's Discussion and Analysis of Financial Condition and Results of
Operations
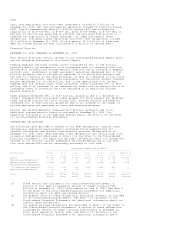
OPERATING EXPENSES
Operating expenses for 2001 totaled $15.5 billion, increasing 2% from $15.1
billion in 2000. Operating capacity decreased 5% to 148 billion ASMs. CASM rose
7% to 10.47(cents), and fuel price neutralized CASM grew 7% to 10.45(cents).
Operating expenses include asset writedowns, restructuring and related items,
net totaling a $1.1 billion charge in 2001 and a $108 million charge in 2000, as
well as Stabilization Act compensation of $634 million in 2001 (see Notes 16 and
19, respectively, of the Notes to the Consolidated Financial Statements).
Excluding these items, operating expenses remained flat at $15.0 billion, CASM
rose 5% to 10.14(cents), and fuel price neutralized CASM grew 5% to
10.12(cents).
Salaries and related costs increased 3% during 2001 to $6.1 billion, primarily
due to a rise in costs associated with a new collective bargaining agreement
between Delta and its pilots.
Aircraft fuel expense decreased 8% in 2001. Total gallons consumed decreased 9%
due primarily to a decrease in flights resulting from the September 11 terrorist
attacks and the Comair pilot strike, as well as fuel efficiencies realized from
our fleet renewal efforts. The average fuel price per gallon rose 2% to
68.60(cents). Our fuel cost is shown net of fuel hedge gains of $299 million for
2001 and $684 million for 2000. Approximately 58% and 67% of our aircraft fuel
requirements were hedged during 2001 and 2000, respectively. For additional
information about our fuel hedge contracts, see Note 4 of the Notes to the
Consolidated Financial Statements.
Depreciation and amortization expense rose 8% in 2001 due to the acquisition of
additional aircraft and ground equipment. Contracted services expense increased
5% resulting primarily from a 1% rise due to rate increases for building and
equipment maintenance and a 1% increase due to a rise in security costs. Landing
fees and other rents rose 1%. This change includes a 2% rise from increased
rates at various locations and a 2% decrease due to Comair's reduced operations
from its pilot strike. Aircraft maintenance materials and outside repairs
expense grew 11% due primarily to the timing of certain maintenance work.
Aircraft rent expense decreased 1% due to a decrease in the number of leased
aircraft.
Other selling expenses decreased 10% due to a lower volume of credit card
charges from lower revenue. Passenger commission expense declined 18%, primarily
as a result of lower passenger revenues. Passenger service expense decreased 1%.
Asset writedowns, restructuring and related items, net totaled $1.1 billion in
2001 compared to $108 million in 2000. Our 2001 charge is described on page 16.
Our 2000 charge consists of $86 million related to our decision to offer an
early retirement medical option program and $22 million from the closure of our
Pacific gateway in Portland, Oregon. See Note 16 of the Notes to the
Consolidated Financial Statements for additional information on these asset
writedowns, restructuring and related items, net.
Stabilization Act compensation totaled $634 million in 2001. This represents the
amount we recognized in 2001 as compensation under the Stabilization Act. See
Note 19 of the Notes to the Consolidated Financial Statements for additional
information.
Other operating expenses decreased 4% as a result of decreases in miscellaneous
expenses such as fuel-related taxes, interrupted trip expenses and professional
fees, which were partially offset by a 2% increase due to new uniform costs and
a 3% increase due to higher insurance expenses.
OPERATING INCOME (LOSS) AND OPERATING MARGIN
We incurred an operating loss of $1.6 billion in 2001, compared to operating
income of $1.6 billion in 2000. Operating margin was (12%) and 10% for 2001 and
2000, respectively. Excluding asset writedowns, restructuring and related items,
net and Stabilization Act compensation discussed above, we incurred an operating
loss of $1.1 billion in 2001, compared to operating income of $1.7 billion in
2000. Operating margin excluding these items was (8%) and 10% for 2001 and 2000,
respectively.
OTHER INCOME (EXPENSE)
Other expense totaled $262 million during 2001, compared to other expense of $88
million in 2000. Included in these results are the following:
- A $301 million gain in 2000 for the sale of certain investments. This
includes a $73 million gain from the sale of 1.2 million shares
of priceline.com, Incorporated (priceline) common stock and a $228
million non-cash gain from the exchange of six million shares of