Delta Airlines 2002 Annual Report Download - page 165
Download and view the complete annual report
Please find page 165 of the 2002 Delta Airlines annual report below. You can navigate through the pages in the report by either clicking on the pages listed below, or by using the keyword search tool below to find specific information within the annual report.-
 1
1 -
2
-
3
-
4
-
5
-
6
-
7
-
8
-
9
-
10
-
11
-
12
-
13
-
14
-
15
-
16
-
17
-
18
-
19
-
20
-
21
-
22
-
23
-
24
-
25
-
26
-
27
-
28
-
29
-
30
-
31
-
32
-
33
-
34
-
35
-
36
-
37
-
38
-
39
-
40
-
41
-
42
-
43
-
44
-
45
-
46
-
47
-
48
-
49
-
50
-
51
-
52
-
53
-
54
-
55
-
56
-
57
-
58
-
59
-
60
-
61
-
62
-
63
-
64
-
65
-
66
-
67
-
68
-
69
-
70
-
71
-
72
-
73
-
74
-
75
-
76
-
77
-
78
-
79
-
80
-
81
-
82
-
83
-
84
-
85
-
86
-
87
-
88
-
89
-
90
-
91
-
92
-
93
-
94
-
95
-
96
-
97
-
98
-
99
-
100
-
101
-
102
-
103
-
104
-
105
-
106
-
107
-
108
-
109
-
110
-
111
-
112
-
113
-
114
-
115
-
116
-
117
-
118
-
119
-
120
-
121
-
122
-
123
-
124
-
125
-
126
-
127
-
128
-
129
-
130
-
131
-
132
-
133
-
134
-
135
-
136
-
137
-
138
-
139
-
140
-
141
-
142
-
143
-
144
-
145
-
146
-
147
-
148
-
149
-
150
-
151
-
152
-
153
-
154
-
 155
155 -
 156
156 -
 157
157 -
 158
158 -
 159
159 -
 160
160 -
 161
161 -
 162
162 -
 163
163 -
 164
164 -
 165
165 -
 166
166 -
 167
167 -
 168
168 -
 169
169 -
 170
170 -
 171
171 -
 172
172 -
 173
173 -
 174
174 -
 175
175 -
176
-
177
-
178
-
179
-
180
-
181
-
182
-
183
-
184
-
185
-
186
-
187
-
188
-
189
-
190
-
191
-
192
-
193
-
194
-
195
-
196
-
197
-
198
-
199
-
200
 |
 |
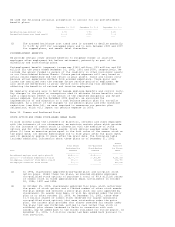
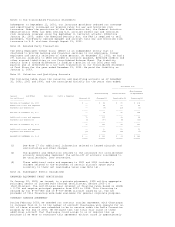
The following table shows the components of accumulated other comprehensive
income (loss) at December 31, 2002, 2001 and 2000, and the activity for the
years then ended:
Additional
Minimum Fuel Marketable
Pension Derivative Equity
(in millions) Liability Instruments Securities Other Total
------------- ---------- ----------- ---------- ----- --------
Balance at December 31, 1999 $ -- $ -- $ 266 $ -- $ 266
-------- ------ ------ ---- --------
Unrealized gain (loss) -- 814 16 -- 830
Realized (gain) loss -- (375) (301) -- (676)
Tax effect -- (171) 111 -- (60)
-------- ------ ------ ---- --------
Net of tax -- 268 (174) -- 94
-------- ------ ------ ---- --------
Balance at December 31, 2000 -- 268 92 -- 360
-------- ------ ------ ---- --------
Unrealized gain (loss) -- (100) (84) 2 (182)
Realized (gain) loss -- (299) (73) -- (372)
Tax effect -- 156 64 (1) 219
-------- ------ ------ ---- --------
Net of tax -- (243) (93) 1 (335)
-------- ------ ------ ---- --------
Balance at December 31, 2001 -- 25 (1) 1 25
-------- ------ ------ ---- --------
Additional minimum pension liability adjustment (2,558) -- -- -- (2,558)
Unrealized gain (loss) -- 143 (9) (2) 132
Realized (gain) loss -- (136) 4 -- (132)
Tax effect 972 (3) 1 1 971
-------- ------ ------ ---- --------
Net of tax (1,586) 4 (4) (1) (1,587)
-------- ------ ------ ---- --------
BALANCE AT DECEMBER 31, 2002 $ (1,586) $ 29 $ (5) $ -- $ (1,562)
======== ====== ====== ==== ========
We anticipate that gains of $29 million, net of tax, will be realized during
2003 as (1) fuel hedge contracts settle and (2) the related aircraft fuel
purchases being hedged are consumed and recognized in expense. For additional
information regarding our fuel hedge contracts, see Note 4.
See Note 11 for further information related to the additional minimum pension
liability.
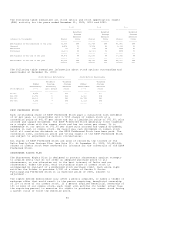
Note 15. Geographic Information
SFAS No. 131, "Disclosures about Segments of an Enterprise and Related
Information" (SFAS 131), requires us to disclose certain information about our
operating segments. Operating segments are defined as components of an
enterprise with separate financial information which is evaluated regularly by
the chief operating decision-maker and is used in resource allocation and
performance assessments.
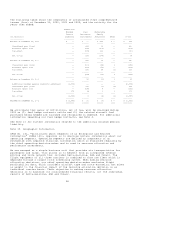
We are managed as a single business unit that provides air transportation for
passengers and cargo. This allows us to benefit from an integrated revenue
pricing and route network that includes Delta-mainline, ASA and Comair. The
flight equipment of all three carriers is combined to form one fleet which is
deployed through a single route scheduling system. When making resource
allocation decisions, our chief operating decision-maker evaluates flight
profitability data, which considers aircraft type and route economics, but gives
no weight to the financial impact of the resource allocation decision on an
individual carrier basis. Their objective in making resource allocation
decisions is to maximize our consolidated financial results, not the individual
results of Delta-mainline, ASA and Comair.
58