Cricket Wireless 2010 Annual Report Download - page 96
Download and view the complete annual report
Please find page 96 of the 2010 Cricket Wireless annual report below. You can navigate through the pages in the report by either clicking on the pages listed below, or by using the keyword search tool below to find specific information within the annual report.
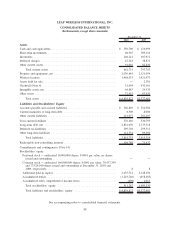
LEAP WIRELESS INTERNATIONAL, INC.
CONSOLIDATED STATEMENTS OF CASH FLOWS
(In thousands)
2010 2009 2008
Year Ended December 31,
Operating activities:
Netloss ........................................... $ (785,055) $ (237,963) $(143,381)
Adjustments to reconcile net loss to net cash provided by
operating activities:
Share-based compensation expense...................... 36,609 42,713 35,215
Depreciation and amortization ......................... 457,035 410,697 331,448
Accretion of asset retirement obligations ................. 2,503 1,888 1,153
Non-cash interest items, net ........................... 11,446 8,357 13,057
Non-cash loss on extinguishment of debt ................. (2,040) 8,805 —
Deferred income tax expense .......................... 39,263 38,164 36,310
Impairment of assets ................................ 477,327 639 177
Impairment of short-term investments.................... — — 7,538
(Gain) loss on sale or disposal of assets .................. 5,061 418 209
Equity in net (income) loss of investees .................. (1,912) (3,946) 298
Changes in assets and liabilities:
Inventories and deferred charges ...................... (2,469) (20,491) (60,899)
Other assets ..................................... (16,791) (18,759) (21,221)
Accounts payable and accrued liabilities ................ 63,120 5,674 75,344
Other liabilities .................................. 28,181 48,121 75,398
Net cash provided by operating activities ............... 312,278 284,317 350,646
Investing activities:
Acquisition of a business ............................... (40,730) — (31,217)
Purchases of property and equipment ...................... (398,894) (699,525) (795,678)
Change in prepayments for purchases of property and
equipment . ....................................... 1,412 5,691 (5,876)
Purchases of and deposits for wireless licenses and spectrum
clearing costs ..................................... (13,319) (35,356) (78,451)
Return of deposit for wireless licenses ..................... — — 70,000
Proceeds from sale of wireless licenses and operating assets ..... — 2,965 —
Purchases of investments ............................... (488,450) (883,173) (598,015)
Sales and maturities of investments ....................... 816,247 733,268 532,468
Purchases of membership units of equity method investments .... (967) — (1,033)
Change in restricted cash ............................... 749 338 (2,176)
Net cash used in investing activities ................... (123,952) (875,792) (909,978)
Financing activities:
Proceeds from issuance of long-term debt .................. 1,179,876 1,057,474 535,750
Repayment of long-term debt ........................... (1,118,096) (897,904) (10,500)
Payment of debt issuance costs .......................... (1,308) (16,200) (7,658)
Purchase of non-controlling interests ...................... (77,664) — —
Non-controlling interest contribution ...................... 5,100 — —
Proceeds from issuance of common stock .................. 1,535 267,105 7,885
Other ............................................. (1,978) (1,709) (41,774)
Net cash provided by (used in) financing activities ........ (12,535) 408,766 483,703
Net increase (decrease) in cash and cash equivalents ............ 175,791 (182,709) (75,629)
Cash and cash equivalents at beginning of period ............... 174,999 357,708 433,337
Cash and cash equivalents at end of period ................... $ 350,790 $ 174,999 $ 357,708
See accompanying notes to consolidated financial statements.
90


