Cricket Wireless 2010 Annual Report Download - page 74
Download and view the complete annual report
Please find page 74 of the 2010 Cricket Wireless annual report below. You can navigate through the pages in the report by either clicking on the pages listed below, or by using the keyword search tool below to find specific information within the annual report.-
 1
1 -
2
-
3
-
4
-
5
-
6
-
7
-
8
-
9
-
10
-
11
-
12
-
13
-
14
-
15
-
16
-
17
-
18
-
19
-
20
-
21
-
22
-
23
-
24
-
25
-
26
-
27
-
28
-
29
-
30
-
31
-
32
-
33
-
34
-
35
-
36
-
37
-
38
-
39
-
40
-
41
-
42
-
43
-
44
-
45
-
46
-
47
-
48
-
49
-
50
-
51
-
52
-
53
-
54
-
55
-
56
-
57
-
58
-
59
-
60
-
61
-
62
-
63
-
 64
64 -
 65
65 -
 66
66 -
 67
67 -
 68
68 -
 69
69 -
 70
70 -
 71
71 -
 72
72 -
 73
73 -
 74
74 -
 75
75 -
 76
76 -
 77
77 -
 78
78 -
 79
79 -
 80
80 -
 81
81 -
 82
82 -
 83
83 -
 84
84 -
85
-
86
-
87
-
88
-
89
-
90
-
91
-
92
-
93
-
94
-
95
-
96
-
97
-
98
-
99
-
100
-
101
-
102
-
103
-
104
-
105
-
106
-
107
-
108
-
109
-
110
-
111
-
112
-
113
-
114
-
115
-
116
-
117
-
118
-
119
-
120
-
121
-
122
-
123
-
124
-
125
-
126
-
127
-
128
-
129
-
130
-
131
-
132
-
133
-
134
-
135
-
136
-
137
-
138
-
139
-
140
-
141
-
142
-
143
-
144
-
145
-
146
-
147
-
148
-
149
-
150
-
151
-
152
-
153
-
154
-
155
-
156
-
157
-
158
-
159
-
160
-
161
-
162
-
163
-
164
-
165
-
166
-
167
-
168
-
169
-
170
-
171
-
172
 |
 |

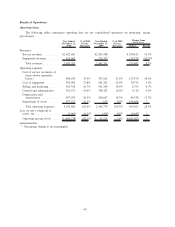
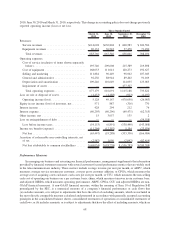
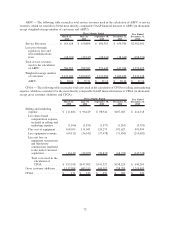
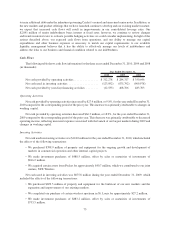
2010, June 30, 2010 and March 31, 2010, respectively. This change in accounting policy does not change previously
reported operating income (loss) or net loss.
March 31,
2010
June 30,
2010
September 30,
2010
December 31,
2010
Three Months Ended
Revenues:
Service revenues ........................... $614,628 $630,804 $ 600,583 $ 636,586
Equipment revenues ......................... 69,132 36,542 37,478 71,450
Total revenues ........................... 683,760 667,346 638,061 708,036
Operating expenses:
Cost of service (exclusive of items shown separately
below)................................. 195,740 209,608 215,389 219,898
Cost of equipment .......................... 168,053 111,041 120,273 192,627
Selling and marketing ....................... 111,884 96,449 98,942 107,043
General and administrative .................... 92,256 88,944 89,202 91,169
Depreciation and amortization ................. 109,246 110,649 114,055 123,085
Impairment of assets ........................ — — 477,327 —
Total operating expenses .................... 677,179 616,691 1,115,188 733,822
Loss on sale or disposal of assets ................. (1,453) (1,488) (923) (1,197)
Operating income (loss) ...................... 5,128 49,167 (478,050) (26,983)
Equity in net income (loss) of investees, net ......... 571 887 (316) 770
Interest income . ............................. 428 294 212 76
Interest expense . ............................. (60,295) (60,296) (60,471) (62,315)
Other income, net ............................ 15 3,057 135 2
Loss on extinguishment of debt .................. — — — (54,558)
Loss before income taxes ..................... (54,153) (6,891) (538,490) (143,008)
Income tax benefit (expense) .................... (11,294) (12,397) 5,154 (23,976)
Netloss.................................. (65,447) (19,288) (533,336) (166,984)
Accretion of redeemable non-controlling interests, net
oftax ................................... (2,587) 1,050 (2,947) (82,414)
Net loss attributable to common stockholders ...... $(68,034) $ (18,238) $ (536,283) $(249,398)
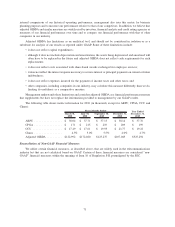
Performance Measures
In managing our business and assessing our financial performance, management supplements the information
provided by financial statement measures with several customer-focused performance metrics that are widely used
in the telecommunications industry. These metrics include average revenue per user per month, or ARPU, which
measures average service revenue per customer; cost per gross customer addition, or CPGA, which measures the
average cost of acquiring a new customer; cash costs per user per month, or CCU, which measures the non-selling
cash cost of operating our business on a per customer basis; churn, which measures turnover in our customer base;
and adjusted OIBDA, which measures operating performance. ARPU, CPGA, CCU and adjusted OIBDA are non-
GAAP financial measures. A non-GAAP financial measure, within the meaning of Item 10 of Regulation S-K
promulgated by the SEC, is a numerical measure of a company’s financial performance or cash flows that
(a) excludes amounts, or is subject to adjustments that have the effect of excluding amounts, which are included in
the most directly comparable measure calculated and presented in accordance with generally accepted accounting
principles in the consolidated balance sheets, consolidated statements of operations or consolidated statements of
cash flows; or (b) includes amounts, or is subject to adjustments that have the effect of including amounts, which are
68