Cricket Wireless 2010 Annual Report Download - page 81
Download and view the complete annual report
Please find page 81 of the 2010 Cricket Wireless annual report below. You can navigate through the pages in the report by either clicking on the pages listed below, or by using the keyword search tool below to find specific information within the annual report.-
 1
1 -
2
-
3
-
4
-
5
-
6
-
7
-
8
-
9
-
10
-
11
-
12
-
13
-
14
-
15
-
16
-
17
-
18
-
19
-
20
-
21
-
22
-
23
-
24
-
25
-
26
-
27
-
28
-
29
-
30
-
31
-
32
-
33
-
34
-
35
-
36
-
37
-
38
-
39
-
40
-
41
-
42
-
43
-
44
-
45
-
46
-
47
-
48
-
49
-
50
-
51
-
52
-
53
-
54
-
55
-
56
-
57
-
58
-
59
-
60
-
61
-
62
-
63
-
64
-
65
-
66
-
67
-
68
-
69
-
70
-
 71
71 -
 72
72 -
 73
73 -
 74
74 -
 75
75 -
 76
76 -
 77
77 -
 78
78 -
 79
79 -
 80
80 -
 81
81 -
 82
82 -
 83
83 -
 84
84 -
 85
85 -
 86
86 -
 87
87 -
 88
88 -
 89
89 -
 90
90 -
 91
91 -
92
-
93
-
94
-
95
-
96
-
97
-
98
-
99
-
100
-
101
-
102
-
103
-
104
-
105
-
106
-
107
-
108
-
109
-
110
-
111
-
112
-
113
-
114
-
115
-
116
-
117
-
118
-
119
-
120
-
121
-
122
-
123
-
124
-
125
-
126
-
127
-
128
-
129
-
130
-
131
-
132
-
133
-
134
-
135
-
136
-
137
-
138
-
139
-
140
-
141
-
142
-
143
-
144
-
145
-
146
-
147
-
148
-
149
-
150
-
151
-
152
-
153
-
154
-
155
-
156
-
157
-
158
-
159
-
160
-
161
-
162
-
163
-
164
-
165
-
166
-
167
-
168
-
169
-
170
-
171
-
172
 |
 |

to incur additional debt under the indentures governing Cricket’s secured and unsecured senior notes. In addition, as
the new markets and product offerings that we have launched continue to develop and our existing markets mature,
we expect that increased cash flows will result in improvements in our consolidated leverage ratio. Our
$2,841 million of senior indebtedness bears interest at fixed rates; however, we continue to review changes
and trends in interest rates to evaluate possible hedging activities we could consider implementing. In light of the
actions described above, our expected cash flows from operations, and our ability to manage our capital
expenditures and other business expenses as necessary to match our capital requirements to our available
liquidity, management believes that it has the ability to effectively manage our levels of indebtedness and
address the risks to our business and financial condition related to our indebtedness.
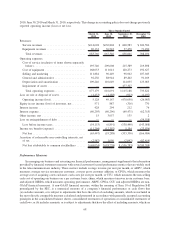
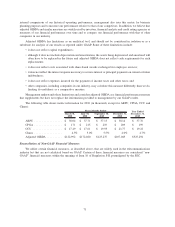
Cash Flows
The following table shows cash flow information for the three years ended December 31, 2010, 2009 and 2008
(in thousands):
2010 2009 2008
Year Ended December 31,
Net cash provided by operating activities................ $312,278 $ 284,317 $ 350,646
Net cash used in investing activities ................... (123,952) (875,792) (909,978)
Net cash provided by (used in) financing activities ........ (12,535) 408,766 483,703
Operating Activities
Net cash provided by operating activities increased by $27.9 million, or 9.8%, for the year ended December 31,
2010 compared to the corresponding period of the prior year. This increase was primarily attributable to changes in
working capital.
Net cash provided by operating activities decreased $66.3 million, or 18.9%, for the year ended December 31,
2009 compared to the corresponding period of the prior year. This decrease was primarily attributable to decreased
operating income, reflecting increased expenses associated with the launch of our largest markets during 2009 and
changes in working capital.
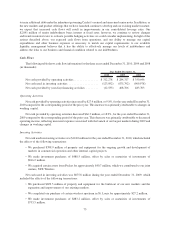
Investing Activities
Net cash used in investing activities was $124.0 million for the year ended December 31, 2010, which included
the effects of the following transactions:
• We purchased $398.9 million of property and equipment for the ongoing growth and development of
markets in commercial operation and other internal capital projects.
• We made investment purchases of $488.5 million, offset by sales or maturities of investments of
$816.2 million.
• We acquired certain assets from Pocket for approximately $40.7 million, which we contributed to our joint
venture, STX Wireless.
Net cash used in investing activities was $875.8 million during the year ended December 31, 2009, which
included the effects of the following transactions:
• We purchased $699.5 million of property and equipment for the build-out of our new markets and the
expansion and improvement of our existing markets.
• We completed our purchase of certain wireless spectrum in St. Louis for approximately $27.2 million.
• We made investment purchases of $883.2 million, offset by sales or maturities of investments of
$733.3 million.
75