Cricket Wireless 2010 Annual Report Download - page 53
Download and view the complete annual report
Please find page 53 of the 2010 Cricket Wireless annual report below. You can navigate through the pages in the report by either clicking on the pages listed below, or by using the keyword search tool below to find specific information within the annual report.-
 1
1 -
2
-
3
-
4
-
5
-
6
-
7
-
8
-
9
-
10
-
11
-
12
-
13
-
14
-
15
-
16
-
17
-
18
-
19
-
20
-
21
-
22
-
23
-
24
-
25
-
26
-
27
-
28
-
29
-
30
-
31
-
32
-
33
-
34
-
35
-
36
-
37
-
38
-
39
-
40
-
41
-
42
-
 43
43 -
 44
44 -
 45
45 -
 46
46 -
 47
47 -
 48
48 -
 49
49 -
 50
50 -
 51
51 -
 52
52 -
 53
53 -
 54
54 -
 55
55 -
 56
56 -
 57
57 -
 58
58 -
 59
59 -
 60
60 -
 61
61 -
 62
62 -
 63
63 -
64
-
65
-
66
-
67
-
68
-
69
-
70
-
71
-
72
-
73
-
74
-
75
-
76
-
77
-
78
-
79
-
80
-
81
-
82
-
83
-
84
-
85
-
86
-
87
-
88
-
89
-
90
-
91
-
92
-
93
-
94
-
95
-
96
-
97
-
98
-
99
-
100
-
101
-
102
-
103
-
104
-
105
-
106
-
107
-
108
-
109
-
110
-
111
-
112
-
113
-
114
-
115
-
116
-
117
-
118
-
119
-
120
-
121
-
122
-
123
-
124
-
125
-
126
-
127
-
128
-
129
-
130
-
131
-
132
-
133
-
134
-
135
-
136
-
137
-
138
-
139
-
140
-
141
-
142
-
143
-
144
-
145
-
146
-
147
-
148
-
149
-
150
-
151
-
152
-
153
-
154
-
155
-
156
-
157
-
158
-
159
-
160
-
161
-
162
-
163
-
164
-
165
-
166
-
167
-
168
-
169
-
170
-
171
-
172
 |
 |

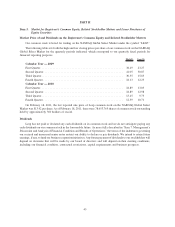
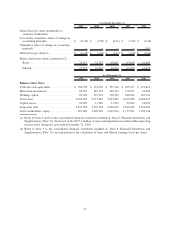
2010 2009 2008 2007 2006
Year Ended December 31,
Diluted loss per share attributable to
common stockholders:
Loss before cumulative effect of change in
accounting principle ................ $ (11.49) $ (3.30) $ (2.21) $ (1.20) $ (0.44)
Cumulative effect of change in accounting
principle......................... — — — — 0.01
Diluted loss per share(2)............... $ (11.49) $ (3.30) $ (2.21) $ (1.20) $ (0.43)
Shares used in per share calculations:(2)
Basic ........................... 75,917 72,515 68,021 67,100 61,645
Diluted.......................... 75,917 72,515 68,021 67,100 61,645
2010 2009 2008 2007 2006
As of December 31,
Balance Sheet Data:
Cash and cash equivalents ............. $ 350,790 $ 174,999 $ 357,708 $ 433,337 $ 372,812
Short-term investments ................ 68,367 389,154 238,143 179,233 66,400
Working capital ..................... 85,305 272,974 278,576 380,384 185,191
Total assets ........................ 4,834,823 5,377,481 5,052,857 4,432,998 4,084,947
Capital leases ....................... 10,307 12,285 13,993 53,283 16,459
Long-term debt ..................... 2,832,070 2,735,318 2,566,025 2,033,902 1,676,500
Total stockholders’ equity .............. 911,282 1,690,530 1,612,676 1,717,505 1,769,348
(1) Refer to Notes 3 and 6 to the consolidated financial statements included in “Item 8. Financial Statements and
Supplementary Data” for discussion of the $477.3 million of non-cash impairment recorded within operating
income (loss) during the year ended December 31, 2010.
(2) Refer to Note 3 to the consolidated financial statements included in “Item 8. Financial Statements and
Supplementary Data” for an explanation of the calculation of basic and diluted earnings (loss) per share.
47