Cricket Wireless 2010 Annual Report Download - page 167
Download and view the complete annual report
Please find page 167 of the 2010 Cricket Wireless annual report below. You can navigate through the pages in the report by either clicking on the pages listed below, or by using the keyword search tool below to find specific information within the annual report.-
 1
1 -
2
-
3
-
4
-
5
-
6
-
7
-
8
-
9
-
10
-
11
-
12
-
13
-
14
-
15
-
16
-
17
-
18
-
19
-
20
-
21
-
22
-
23
-
24
-
25
-
26
-
27
-
28
-
29
-
30
-
31
-
32
-
33
-
34
-
35
-
36
-
37
-
38
-
39
-
40
-
41
-
42
-
43
-
44
-
45
-
46
-
47
-
48
-
49
-
50
-
51
-
52
-
53
-
54
-
55
-
56
-
57
-
58
-
59
-
60
-
61
-
62
-
63
-
64
-
65
-
66
-
67
-
68
-
69
-
70
-
71
-
72
-
73
-
74
-
75
-
76
-
77
-
78
-
79
-
80
-
81
-
82
-
83
-
84
-
85
-
86
-
87
-
88
-
89
-
90
-
91
-
92
-
93
-
94
-
95
-
96
-
97
-
98
-
99
-
100
-
101
-
102
-
103
-
104
-
105
-
106
-
107
-
108
-
109
-
110
-
111
-
112
-
113
-
114
-
115
-
116
-
117
-
118
-
119
-
120
-
121
-
122
-
123
-
124
-
125
-
126
-
127
-
128
-
129
-
130
-
131
-
132
-
133
-
134
-
135
-
136
-
137
-
138
-
139
-
140
-
141
-
142
-
143
-
144
-
145
-
146
-
147
-
148
-
149
-
150
-
151
-
152
-
153
-
154
-
155
-
156
-
 157
157 -
 158
158 -
 159
159 -
 160
160 -
 161
161 -
 162
162 -
 163
163 -
 164
164 -
 165
165 -
 166
166 -
 167
167 -
 168
168 -
 169
169 -
 170
170 -
 171
171 -
 172
172
 |
 |
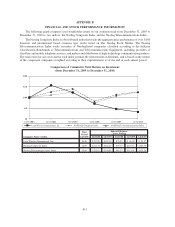
APPENDIX B
FINANCIAL AND STOCK PERFORMANCE INFORMATION
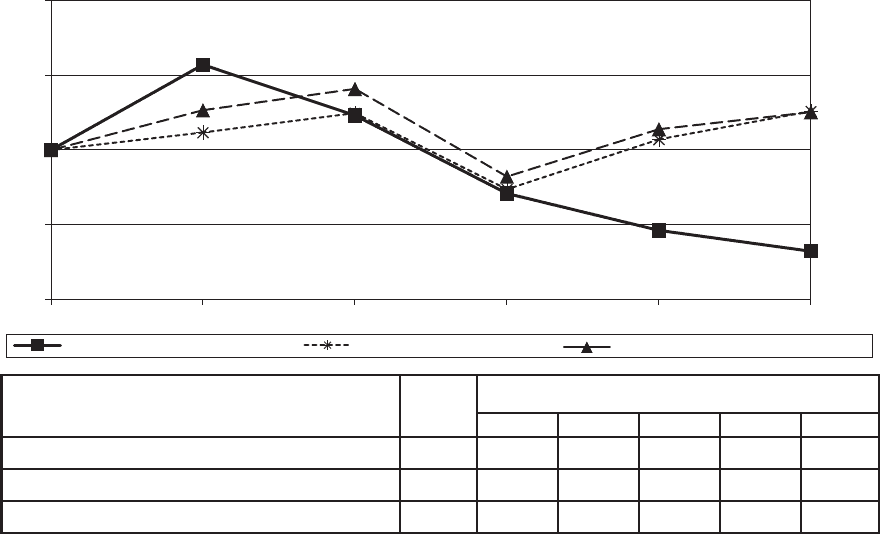
The following graph compares total stockholder return on our common stock from December 31, 2005 to
December 31, 2010 to two indices: the Nasdaq Composite Index and the Nasdaq Telecommunications Index.
The Nasdaq Composite Index is a broad-based index that tracks the aggregate price performance of over 3,000
domestic and international based common type stocks listed on The Nasdaq Stock Market. The Nasdaq
Telecommunications Index tracks securities of Nasdaq-listed companies classified according to the Industry
Classification Benchmark as Telecommunications and Telecommunications Equipment, including providers of
fixed-line and mobile telephone services, and makers and distributors of high-technology communication products.
The total return for our stock and for each index assumes the reinvestment of dividends, and is based on the returns
of the component companies weighted according to their capitalizations as of the end of each annual period.
Comparison of Cumulative Total Return on Investment
(from December 31, 2005 to December 31, 2010)
12/31/201012/31/200912/31/200812/31/200712/31/200612/31/2005
NASDAQ Telecommunications Index
NASDAQ Composite Index
Leap Wireless International, Inc.
$0
$50
$100
$150
$200
Company Name / Index
Base
Period
12/31/05 12/31/06 12/31/07 12/31/08 12/31/09 12/31/10
Indexed Returns
Years Ending
Leap Wireless International, Inc. $100 $157.00 $123.13 $70.99 $ 46.33 $ 32.37
Nasdaq Composite Index $100 $111.74 $124.67 $73.77 $107.12 $125.93
Nasdaq Telecommunications Index $100 $126.62 $140.88 $82.27 $113.93 $125.30
B-1