Cricket Wireless 2010 Annual Report Download - page 68
Download and view the complete annual report
Please find page 68 of the 2010 Cricket Wireless annual report below. You can navigate through the pages in the report by either clicking on the pages listed below, or by using the keyword search tool below to find specific information within the annual report.-
 1
1 -
2
-
3
-
4
-
5
-
6
-
7
-
8
-
9
-
10
-
11
-
12
-
13
-
14
-
15
-
16
-
17
-
18
-
19
-
20
-
21
-
22
-
23
-
24
-
25
-
26
-
27
-
28
-
29
-
30
-
31
-
32
-
33
-
34
-
35
-
36
-
37
-
38
-
39
-
40
-
41
-
42
-
43
-
44
-
45
-
46
-
47
-
48
-
49
-
50
-
51
-
52
-
53
-
54
-
55
-
56
-
57
-
 58
58 -
 59
59 -
 60
60 -
 61
61 -
 62
62 -
 63
63 -
 64
64 -
 65
65 -
 66
66 -
 67
67 -
 68
68 -
 69
69 -
 70
70 -
 71
71 -
 72
72 -
 73
73 -
 74
74 -
 75
75 -
 76
76 -
 77
77 -
 78
78 -
79
-
80
-
81
-
82
-
83
-
84
-
85
-
86
-
87
-
88
-
89
-
90
-
91
-
92
-
93
-
94
-
95
-
96
-
97
-
98
-
99
-
100
-
101
-
102
-
103
-
104
-
105
-
106
-
107
-
108
-
109
-
110
-
111
-
112
-
113
-
114
-
115
-
116
-
117
-
118
-
119
-
120
-
121
-
122
-
123
-
124
-
125
-
126
-
127
-
128
-
129
-
130
-
131
-
132
-
133
-
134
-
135
-
136
-
137
-
138
-
139
-
140
-
141
-
142
-
143
-
144
-
145
-
146
-
147
-
148
-
149
-
150
-
151
-
152
-
153
-
154
-
155
-
156
-
157
-
158
-
159
-
160
-
161
-
162
-
163
-
164
-
165
-
166
-
167
-
168
-
169
-
170
-
171
-
172
 |
 |
customers due primarily to new market launches during 2009 and customer acceptance of our Cricket Broadband
service. This increase was partially offset by a 7.6% decline in average monthly revenue per customer. The decline
in average monthly revenue per customer reflected increased customer acceptance of our lower-priced Cricket
Wireless service plans and increased customer acceptance of our Cricket Broadband service, which is generally
priced lower than our most popular Cricket Wireless service plans. Average monthly revenue per customer for the
year ended December 31, 2009 was also impacted by increased customer deactivations and reactivations due to the
impact of rising unemployment on discretionary spending and increased competitive activity.
Equipment Revenues
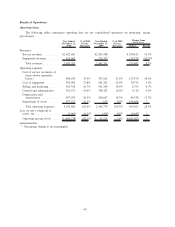
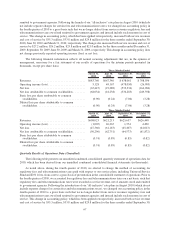
Equipment revenues decreased $24.7 million, or 10.3%, for the year ended December 31, 2010 compared to
the corresponding period of the prior year. A 10.2% increase in the number of devices sold was more than offset by a
reduction in the average revenue per device sold. The reduction in the average revenue per device sold was primarily
due to various device promotions offered to customers, a reduction in the average selling price of our devices to new
and upgrading customers in connection with our August 2010 introduction of “all-inclusive” rate plans, in which we
eliminated the free first month of service and instead decreased the prices of our devices, and an increase in
commissions paid to dealers which are recorded as a reduction of equipment revenue.
Equipment revenues decreased $10.4 million, or 4.2%, for the year ended December 31, 2009 compared to the
corresponding period of the prior year. A 41% increase in the number of devices sold was more than offset by a
reduction in the average revenue per device sold. The reduction in the average revenue per device sold was primarily
due to the increased promotions offered to our customers, the expansion of our low-cost handset offerings and the
expansion of our Cricket PAYGo product offerings.
Cost of Service
Cost of service increased $133.5 million, or 18.9%, for the year ended December 31, 2010 compared to the
corresponding period of the prior year. As a percentage of service revenues, cost of service was 33.9% compared to
31.5% in the prior year period. Principal factors contributing to the increase in cost of service included increases in
roaming and international long distance costs in connection with our introduction of unlimited nationwide roaming
and international long distance services, increases in telecommunications taxes due to increases in federal and state
tax rates and our expansion into markets with higher tax rates, and increases in our fixed network costs associated
with a full year of operations in markets launched in 2009.
Cost of service increased $145.8 million, or 26.0%, for the year ended December 31, 2009 compared to the
corresponding period of the prior year. The most significant factor contributing to the increase in cost of service was
the increase in our fixed costs due to the launch of our two largest markets during 2009 and the resultant increase in
the size of our network footprint and supporting infrastructure. The number of potential customers covered by our
networks increased from approximately 67.2 million covered POPs as of December 31, 2008 to approximately
94.2 million covered POPs as of December 31, 2009.
Cost of Equipment
Cost of equipment increased $30.7 million, or 5.5%, for the year ended December 31, 2010 compared to the
corresponding period of the prior year. A 10.2% increase in the number of devices sold was offset by a reduction in
the average cost per device sold, primarily due to benefits of scale and our cost-management initiatives.
Cost of equipment increased $95.8 million, or 20.6%, for the year ended December 31, 2009 compared to the
corresponding period of the prior year. A 41% increase in handset and broadband data card sales volume was
partially offset by a reduction in the average cost per device sold, primarily due to the expansion of our low-cost
handset offerings and the expansion of our Cricket PAYGo product offerings.
Selling and Marketing Expenses
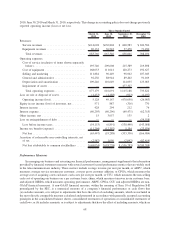
Selling and marketing expenses increased $2.8 million, or 0.7%, for the year ended December 31, 2010
compared to the corresponding period of the prior year. As a percentage of service revenues, such expenses
62