Cricket Wireless 2010 Annual Report Download - page 67
Download and view the complete annual report
Please find page 67 of the 2010 Cricket Wireless annual report below. You can navigate through the pages in the report by either clicking on the pages listed below, or by using the keyword search tool below to find specific information within the annual report.-
 1
1 -
2
-
3
-
4
-
5
-
6
-
7
-
8
-
9
-
10
-
11
-
12
-
13
-
14
-
15
-
16
-
17
-
18
-
19
-
20
-
21
-
22
-
23
-
24
-
25
-
26
-
27
-
28
-
29
-
30
-
31
-
32
-
33
-
34
-
35
-
36
-
37
-
38
-
39
-
40
-
41
-
42
-
43
-
44
-
45
-
46
-
47
-
48
-
49
-
50
-
51
-
52
-
53
-
54
-
55
-
56
-
 57
57 -
 58
58 -
 59
59 -
 60
60 -
 61
61 -
 62
62 -
 63
63 -
 64
64 -
 65
65 -
 66
66 -
 67
67 -
 68
68 -
 69
69 -
 70
70 -
 71
71 -
 72
72 -
 73
73 -
 74
74 -
 75
75 -
 76
76 -
 77
77 -
78
-
79
-
80
-
81
-
82
-
83
-
84
-
85
-
86
-
87
-
88
-
89
-
90
-
91
-
92
-
93
-
94
-
95
-
96
-
97
-
98
-
99
-
100
-
101
-
102
-
103
-
104
-
105
-
106
-
107
-
108
-
109
-
110
-
111
-
112
-
113
-
114
-
115
-
116
-
117
-
118
-
119
-
120
-
121
-
122
-
123
-
124
-
125
-
126
-
127
-
128
-
129
-
130
-
131
-
132
-
133
-
134
-
135
-
136
-
137
-
138
-
139
-
140
-
141
-
142
-
143
-
144
-
145
-
146
-
147
-
148
-
149
-
150
-
151
-
152
-
153
-
154
-
155
-
156
-
157
-
158
-
159
-
160
-
161
-
162
-
163
-
164
-
165
-
166
-
167
-
168
-
169
-
170
-
171
-
172
 |
 |

Year Ended
December 31,
2009
% of 2009
Service
Revenues
Year Ended
December 31,
2008
% of 2008
Service
Revenues Dollars Percent
Change from
Prior Year
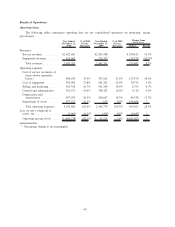
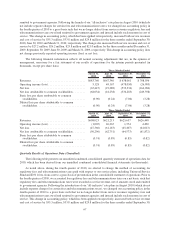
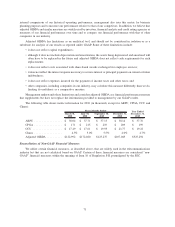
Revenues:
Service revenues ........... $2,241,988 $1,782,163 $459,825 25.8%
Equipment revenues ......... 239,333 249,761 (10,428) (4.2)%
Total revenues ........... 2,481,321 2,031,924 449,397 22.1%
Operating expenses:
Cost of service (exclusive of
items shown separately
below)................. 707,165 31.5% 561,360 31.5% 145,805 26.0%
Cost of equipment .......... 561,262 25.0% 465,422 26.1% 95,840 20.6%
Selling and marketing ....... 411,564 18.4% 294,917 16.5% 116,647 39.6%
General and administrative .... 358,452 16.0% 331,691 18.6% 26,761 8.1%
Depreciation and
amortization............. 410,697 18.3% 331,448 18.6% 79,249 23.9%
Impairment of assets ........ 639 0.0% 177 0.0% 462 261.0%
Total operating expenses .... 2,449,779 109.3% 1,985,015 111.4% 464,764 23.4%
Loss on sale or disposal of assets,
net...................... (418) 0.0% (209) 0.0% (209) (100.0)%
Operating income........... $ 31,124 1.4% $ 46,700 2.6% $(15,576) (33.4)%
The following tables summarize customer activity:
2010 2009 2008
Year Ended December 31,
Gross customer additions ............................ 3,219,485 3,500,113 2,487,579
Net customer additions(1) ........................... 241,546 1,109,445 942,304
Weighted-average number of customers(2) ............... 5,239,638 4,440,822 3,272,347
Total customers, end of period(2) ...................... 5,518,179 4,954,105 3,844,660
(1) Net customer additions for the year ended December 31, 2008 exclude changes in customers that occurred
during the nine months ended September 30, 2008 in the Hargray Wireless markets in South Carolina and
Georgia that we acquired in April 2008. We completed the upgrade of the Hargray Wireless networks and
introduced Cricket service in these markets in October 2008. Commencing with the fourth quarter of 2008, our
net customer additions include customers in the former Hargray Wireless markets.
(2) Weighted average and end of period customers includes approximately 323,000 customers contributed by
Pocket to STX Wireless on October 1, 2010.
Service Revenues
Service revenues increased $240.6 million, or 10.7%, for the year ended December 31, 2010 compared to the
corresponding period of the prior year. This increase resulted from an 18.0% increase in average total customers,
including approximately 323,000 customers contributed by Pocket to STX Wireless on October 1, 2010. This
increase was partially offset by a 6.2% decline in average monthly revenue per customer. The decline in average
monthly revenue per customer was primarily attributable to the impact of former customers of Pocket who remain
on lower-priced, legacy service plans of Pocket and the elimination of certain late payment and reactivation fees in
August 2010, offset by customer adoption of our higher-value service plans.
Service revenues increased $459.8 million, or 25.8%, for the year ended December 31, 2009 compared to the
corresponding period of the prior year. This increase resulted primarily from a 35.7% increase in average total
61