Cricket Wireless 2010 Annual Report Download - page 78
Download and view the complete annual report
Please find page 78 of the 2010 Cricket Wireless annual report below. You can navigate through the pages in the report by either clicking on the pages listed below, or by using the keyword search tool below to find specific information within the annual report.-
 1
1 -
2
-
3
-
4
-
5
-
6
-
7
-
8
-
9
-
10
-
11
-
12
-
13
-
14
-
15
-
16
-
17
-
18
-
19
-
20
-
21
-
22
-
23
-
24
-
25
-
26
-
27
-
28
-
29
-
30
-
31
-
32
-
33
-
34
-
35
-
36
-
37
-
38
-
39
-
40
-
41
-
42
-
43
-
44
-
45
-
46
-
47
-
48
-
49
-
50
-
51
-
52
-
53
-
54
-
55
-
56
-
57
-
58
-
59
-
60
-
61
-
62
-
63
-
64
-
65
-
66
-
67
-
 68
68 -
 69
69 -
 70
70 -
 71
71 -
 72
72 -
 73
73 -
 74
74 -
 75
75 -
 76
76 -
 77
77 -
 78
78 -
 79
79 -
 80
80 -
 81
81 -
 82
82 -
 83
83 -
 84
84 -
 85
85 -
 86
86 -
 87
87 -
 88
88 -
89
-
90
-
91
-
92
-
93
-
94
-
95
-
96
-
97
-
98
-
99
-
100
-
101
-
102
-
103
-
104
-
105
-
106
-
107
-
108
-
109
-
110
-
111
-
112
-
113
-
114
-
115
-
116
-
117
-
118
-
119
-
120
-
121
-
122
-
123
-
124
-
125
-
126
-
127
-
128
-
129
-
130
-
131
-
132
-
133
-
134
-
135
-
136
-
137
-
138
-
139
-
140
-
141
-
142
-
143
-
144
-
145
-
146
-
147
-
148
-
149
-
150
-
151
-
152
-
153
-
154
-
155
-
156
-
157
-
158
-
159
-
160
-
161
-
162
-
163
-
164
-
165
-
166
-
167
-
168
-
169
-
170
-
171
-
172
 |
 |

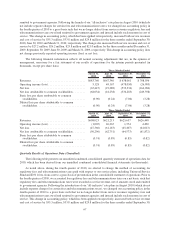
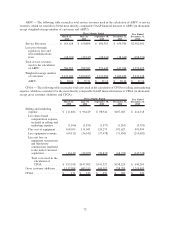
ARPU — The following table reconciles total service revenues used in the calculation of ARPU to service
revenues, which we consider to be the most directly comparable GAAP financial measure to ARPU (in thousands,
except weighted-average number of customers and ARPU):
March 31,
2010
June 30,
2010
September 30,
2010
December 31,
2010
Year Ended
December 31,
2010
Three Months Ended
Service Revenues ....... $ 614,628 $ 630,804 $ 600,583 $ 636,586 $2,482,601
Less pass-through
regulatory fees and
telecommunications
taxes ............... (28,576) (32,217) (28,941) (18,642) (108,376)
Total service revenues
used in the calculation
of ARPU............ 586,052 598,587 571,642 617,944 2,374,225
Weighted-average number
of customers ......... 5,135,102 5,290,825 5,131,982 5,400,449 5,239,638
ARPU.............. $ 38.04 $ 37.71 $ 37.13 $ 38.14 $ 37.76
CPGA — The following table reconciles total costs used in the calculation of CPGA to selling and marketing
expense, which we consider to be the most directly comparable GAAP financial measure to CPGA (in thousands,
except gross customer additions and CPGA):
March 31,
2010
June 30,
2010
September 30,
2010
December 31,
2010
Year Ended
December 31,
2010
Three Months Ended
Selling and marketing
expense .............. $ 111,884 $ 96,449 $ 98,942 $107,043 $ 414,318
Less share-based
compensation expense
included in selling and
marketing expense .... (1,106) (1,831) (1,577) (1,267) (5,781)
Plus cost of equipment . . . 168,053 111,041 120,273 192,627 591,994
Less equipment revenue . . (69,132) (36,542) (37,478) (71,450) (214,602)
Less net loss on
equipment transactions
and third-party
commissions unrelated
to the initial customer
acquisition .......... (16,141) (22,025) (38,833) (68,729) (145,728)
Total costs used in the
calculation of
CPGA ........... $ 193,558 $147,092 $141,327 $158,224 $ 640,201
Gross customer additions . . . 1,132,998 683,315 644,387 758,785 3,219,485
CPGA . ................ $ 171 $ 215 $ 219 $ 209 $ 199
72