Cricket Wireless 2010 Annual Report Download - page 79
Download and view the complete annual report
Please find page 79 of the 2010 Cricket Wireless annual report below. You can navigate through the pages in the report by either clicking on the pages listed below, or by using the keyword search tool below to find specific information within the annual report.-
 1
1 -
2
-
3
-
4
-
5
-
6
-
7
-
8
-
9
-
10
-
11
-
12
-
13
-
14
-
15
-
16
-
17
-
18
-
19
-
20
-
21
-
22
-
23
-
24
-
25
-
26
-
27
-
28
-
29
-
30
-
31
-
32
-
33
-
34
-
35
-
36
-
37
-
38
-
39
-
40
-
41
-
42
-
43
-
44
-
45
-
46
-
47
-
48
-
49
-
50
-
51
-
52
-
53
-
54
-
55
-
56
-
57
-
58
-
59
-
60
-
61
-
62
-
63
-
64
-
65
-
66
-
67
-
68
-
 69
69 -
 70
70 -
 71
71 -
 72
72 -
 73
73 -
 74
74 -
 75
75 -
 76
76 -
 77
77 -
 78
78 -
 79
79 -
 80
80 -
 81
81 -
 82
82 -
 83
83 -
 84
84 -
 85
85 -
 86
86 -
 87
87 -
 88
88 -
 89
89 -
90
-
91
-
92
-
93
-
94
-
95
-
96
-
97
-
98
-
99
-
100
-
101
-
102
-
103
-
104
-
105
-
106
-
107
-
108
-
109
-
110
-
111
-
112
-
113
-
114
-
115
-
116
-
117
-
118
-
119
-
120
-
121
-
122
-
123
-
124
-
125
-
126
-
127
-
128
-
129
-
130
-
131
-
132
-
133
-
134
-
135
-
136
-
137
-
138
-
139
-
140
-
141
-
142
-
143
-
144
-
145
-
146
-
147
-
148
-
149
-
150
-
151
-
152
-
153
-
154
-
155
-
156
-
157
-
158
-
159
-
160
-
161
-
162
-
163
-
164
-
165
-
166
-
167
-
168
-
169
-
170
-
171
-
172
 |
 |

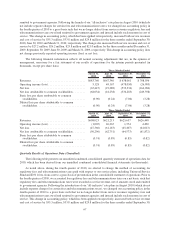
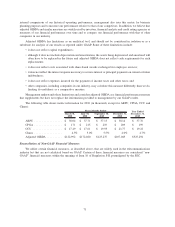
CCU — The following table reconciles total costs used in the calculation of CCU to cost of service, which we
consider to be the most directly comparable GAAP financial measure to CCU (in thousands, except weighted-
average number of customers and CCU):
March 31,
2010
June 30,
2010
September 30,
2010
December 31,
2010
Year Ended
December 31,
2010
Three Months Ended
Cost of service . ........... $ 195,740 $ 209,608 $ 215,389 $ 219,898 $ 840,635
Plus general and
administrative expense . . . 92,256 88,944 89,202 91,169 361,571
Less share-based
compensation expense
included in cost of service
and general and
administrative expense . . . (6,059) (8,885) (7,405) (8,479) (30,828)
Plus net loss on equipment
transactions and third-
party commissions
unrelated to the initial
customer acquisition . . . . 16,141 22,025 38,833 68,729 145,728
Less pass-through regulatory
fees and
telecommunications
taxes ............... (28,576) (32,217) (28,941) (18,642) (108,376)
Total costs used in the
calculation of CCU . . . $ 269,502 $ 279,475 $ 307,078 $ 352,675 $1,208,730
Weighted-average number of
customers . . . ........... 5,135,102 5,290,825 5,131,982 5,400,449 5,239,589
CCU................... $ 17.49 $ 17.61 $ 19.95 $ 21.77 $ 19.22
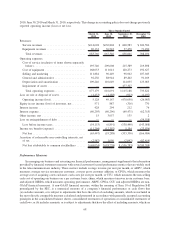
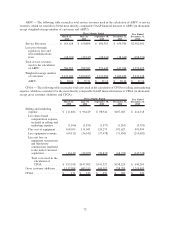
Adjusted OIBDA — The following table reconciles adjusted OIBDA to operating income (loss), which we
consider to be the most directly comparable GAAP financial measure to adjusted OIBDA (in thousands):
March 31,
2010
June 30,
2010
September 30,
2010
December 31,
2010
Year Ended
December 31,
2010
Three Months Ended
Operating income (loss) . . ...... $ 5,128 $ 49,167 $(478,050) $ (26,983) $(450,738)
Plus depreciation and
amortization . . ........... 109,246 110,649 114,055 123,085 457,035
OIBDA.................... $114,374 $159,816 $(363,995) $ 96,102 $ 6,297
Less loss on sale or disposal of
assets . . ................ 1,453 1,488 923 1,197 5,061
Plus impairment of assets ..... — — 477,327 — 477,327
Plus share-based compensation
expense ................ 7,165 10,716 8,982 9,746 36,609
Adjusted OIBDA . . ........... $122,992 $172,020 $ 123,237 $107,045 $ 525,294
Liquidity and Capital Resources
Overview
Our principal sources of liquidity are our existing unrestricted cash, cash equivalents and short-term
investments and cash generated from operations. We had a total of $419.2 million in unrestricted cash, cash
equivalents and short-term investments as of December 31, 2010. We generated $312.3 million of net cash from
operating activities during the year ended December 31, 2010, and we expect that cash from operations will
continue to be a significant and increasing source of liquidity as our markets continue to mature and our business
73