Cricket Wireless 2010 Annual Report Download - page 66
Download and view the complete annual report
Please find page 66 of the 2010 Cricket Wireless annual report below. You can navigate through the pages in the report by either clicking on the pages listed below, or by using the keyword search tool below to find specific information within the annual report.-
 1
1 -
2
-
3
-
4
-
5
-
6
-
7
-
8
-
9
-
10
-
11
-
12
-
13
-
14
-
15
-
16
-
17
-
18
-
19
-
20
-
21
-
22
-
23
-
24
-
25
-
26
-
27
-
28
-
29
-
30
-
31
-
32
-
33
-
34
-
35
-
36
-
37
-
38
-
39
-
40
-
41
-
42
-
43
-
44
-
45
-
46
-
47
-
48
-
49
-
50
-
51
-
52
-
53
-
54
-
55
-
 56
56 -
 57
57 -
 58
58 -
 59
59 -
 60
60 -
 61
61 -
 62
62 -
 63
63 -
 64
64 -
 65
65 -
 66
66 -
 67
67 -
 68
68 -
 69
69 -
 70
70 -
 71
71 -
 72
72 -
 73
73 -
 74
74 -
 75
75 -
 76
76 -
77
-
78
-
79
-
80
-
81
-
82
-
83
-
84
-
85
-
86
-
87
-
88
-
89
-
90
-
91
-
92
-
93
-
94
-
95
-
96
-
97
-
98
-
99
-
100
-
101
-
102
-
103
-
104
-
105
-
106
-
107
-
108
-
109
-
110
-
111
-
112
-
113
-
114
-
115
-
116
-
117
-
118
-
119
-
120
-
121
-
122
-
123
-
124
-
125
-
126
-
127
-
128
-
129
-
130
-
131
-
132
-
133
-
134
-
135
-
136
-
137
-
138
-
139
-
140
-
141
-
142
-
143
-
144
-
145
-
146
-
147
-
148
-
149
-
150
-
151
-
152
-
153
-
154
-
155
-
156
-
157
-
158
-
159
-
160
-
161
-
162
-
163
-
164
-
165
-
166
-
167
-
168
-
169
-
170
-
171
-
172
 |
 |

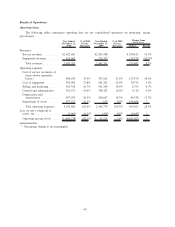
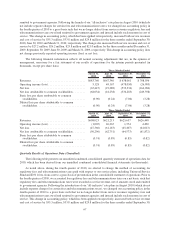
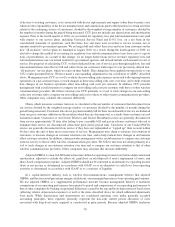
Results of Operations
Operating Items
The following tables summarize operating data for our consolidated operations (in thousands, except
percentages).
Year Ended
December 31,
2010
% of 2010
Service
Revenues
Year Ended
December 31,
2009
% of 2009
Service
Revenues Dollars Percent
Change from
Prior Year
Revenues:
Service revenues . . ......... $2,482,601 $2,241,988 $ 240,613 10.7%
Equipment revenues ........ 214,602 239,333 (24,731) (10.3)%
Total revenues . . ......... 2,697,203 2,481,321 215,882 8.7%
Operating expenses:
Cost of service (exclusive of
items shown separately
below) ................ 840,635 33.9% 707,165 31.5% 133,470 18.9%
Cost of equipment ......... 591,994 23.8% 561,262 25.0% 30,732 5.5%
Selling and marketing ....... 414,318 16.7% 411,564 18.4% 2,754 0.7%
General and administrative . . . 361,571 14.6% 358,452 16.0% 3,119 0.9%
Depreciation and
amortization ............ 457,035 18.4% 410,697 18.3% 46,338 11.3%
Impairment of assets ........ 477,327 19.2% 639 0.0% 476,688 *
Total operating expenses . . . 3,142,880 126.6% 2,449,779 109.3% 693,101 28.3%
Loss on sale or disposal of
assets, net ................ (5,061) (0.2)% (418) 0.0% (4,643) *
Operating income (loss) ..... $(450,738) (18.2)% $ 31,124 1.4% $(481,862) *
* Percentage change is not meaningful
60