Cricket Wireless 2010 Annual Report Download - page 73
Download and view the complete annual report
Please find page 73 of the 2010 Cricket Wireless annual report below. You can navigate through the pages in the report by either clicking on the pages listed below, or by using the keyword search tool below to find specific information within the annual report.-
 1
1 -
2
-
3
-
4
-
5
-
6
-
7
-
8
-
9
-
10
-
11
-
12
-
13
-
14
-
15
-
16
-
17
-
18
-
19
-
20
-
21
-
22
-
23
-
24
-
25
-
26
-
27
-
28
-
29
-
30
-
31
-
32
-
33
-
34
-
35
-
36
-
37
-
38
-
39
-
40
-
41
-
42
-
43
-
44
-
45
-
46
-
47
-
48
-
49
-
50
-
51
-
52
-
53
-
54
-
55
-
56
-
57
-
58
-
59
-
60
-
61
-
62
-
 63
63 -
 64
64 -
 65
65 -
 66
66 -
 67
67 -
 68
68 -
 69
69 -
 70
70 -
 71
71 -
 72
72 -
 73
73 -
 74
74 -
 75
75 -
 76
76 -
 77
77 -
 78
78 -
 79
79 -
 80
80 -
 81
81 -
 82
82 -
 83
83 -
84
-
85
-
86
-
87
-
88
-
89
-
90
-
91
-
92
-
93
-
94
-
95
-
96
-
97
-
98
-
99
-
100
-
101
-
102
-
103
-
104
-
105
-
106
-
107
-
108
-
109
-
110
-
111
-
112
-
113
-
114
-
115
-
116
-
117
-
118
-
119
-
120
-
121
-
122
-
123
-
124
-
125
-
126
-
127
-
128
-
129
-
130
-
131
-
132
-
133
-
134
-
135
-
136
-
137
-
138
-
139
-
140
-
141
-
142
-
143
-
144
-
145
-
146
-
147
-
148
-
149
-
150
-
151
-
152
-
153
-
154
-
155
-
156
-
157
-
158
-
159
-
160
-
161
-
162
-
163
-
164
-
165
-
166
-
167
-
168
-
169
-
170
-
171
-
172
 |
 |

remitted to government agencies. Following the launch of our “all-inclusive” rate plans in August 2010 (which do
not include separate charges for certain fees and telecommunications taxes), we changed our accounting policy in
the fourth quarter of 2010 to a gross basis such that we no longer deduct from service revenues regulatory fees and
telecommunications taxes owed and remitted to government agencies and instead include such amounts in cost of
service. This change in accounting policy, which has been applied retrospectively, increased both service revenues
and cost of service by $35.3 million, $33.8 million and $29.8 million for the three months ended September 30,
2010, June 30, 2010 and March 31, 2010, respectively. The change also increased both service revenue and cost of
service by $27.2 million, $26.2 million, $23.8 million and $21.0 million for the three months ended December 31,
2009, September 30, 2009, June 30, 2009 and March 31, 2009, respectively. This change in accounting policy does
not change previously reported operating income (loss) or net loss.
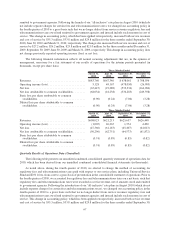
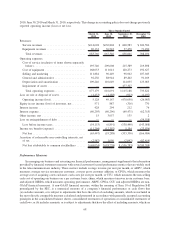
The following financial information reflects all normal recurring adjustments that are, in the opinion of
management, necessary for a fair statement of our results of operations for the interim periods presented (in
thousands, except per share data):
March 31,
2010
June 30,
2010
September 30,
2010
December 31,
2010
Three Months Ended
Revenues................................... $683,760 $667,346 $ 638,061 $ 708,036
Operating income (loss) ........................ 5,128 49,167 (478,050) (26,983)
Netloss.................................... (65,447) (19,288) (533,336) (166,984)
Net loss attributable to common stockholders ........ (68,034) (18,238) (536,283) (249,398)
Basic loss per share attributable to common
stockholders. . ............................. (0.90) (0.24) (7.06) (3.28)
Diluted loss per share attributable to common
stockholders. . ............................. (0.90) (0.24) (7.06) (3.28)
March 31,
2009
June 30,
2009
September 30,
2009
December 31,
2009
Three Months Ended
Revenues................................... $608,023 $621,213 $625,637 $626,448
Operating income (loss) ........................ (1,005) 26,265 1,374 4,490
Netloss.................................... (47,360) (61,183) (65,407) (64,013)
Net loss attributable to common stockholders ........ (50,296) (62,751) (64,573) (61,872)
Basic loss per share attributable to common
stockholders. . ............................. (0.74) (0.89) (0.85) (0.82)
Diluted loss per share attributable to common
stockholders. . ............................. (0.74) (0.89) (0.85) (0.82)
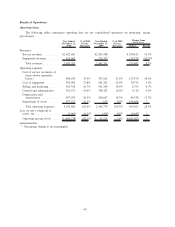
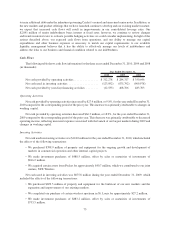
Quarterly Results of Operations Data (Unaudited)
The following table presents our unaudited condensed consolidated quarterly statement of operations data for
2010, which has been derived from our unaudited condensed consolidated financial statements (in thousands):
As noted above, during the fourth quarter of 2010, we elected to change the method of accounting for
regulatory fees and telecommunications taxes paid with respect to our service plans, including Universal Service
Fund and E-911 fees, from a net to a gross basis of presentation in the consolidated statement of operations. Prior to
the fourth quarter of 2010, we accounted for regulatory fees and telecommunications taxes on a net basis, such that
regulatory fees and telecommunications taxes were recorded as service revenue, net of amounts owed and remitted
to government agencies. Following the introduction of our “all-inclusive” rate plans in August 2010 (which do not
include separate charges for certain fees and telecommunications taxes), we changed our accounting policy in the
fourth quarter of 2010 to a gross basis such that we no longer deduct from service revenues regulatory fees and
telecommunications taxes owed and remitted to government agencies and instead include such amounts in cost of
service. This change in accounting policy, which has been applied retrospectively, increased both service revenue
and cost of service by $35.3 million, $33.8 million and $29.8 million for the three months ended September 30,
67