Cricket Wireless 2010 Annual Report Download - page 110
Download and view the complete annual report
Please find page 110 of the 2010 Cricket Wireless annual report below. You can navigate through the pages in the report by either clicking on the pages listed below, or by using the keyword search tool below to find specific information within the annual report.-
 1
1 -
2
-
3
-
4
-
5
-
6
-
7
-
8
-
9
-
10
-
11
-
12
-
13
-
14
-
15
-
16
-
17
-
18
-
19
-
20
-
21
-
22
-
23
-
24
-
25
-
26
-
27
-
28
-
29
-
30
-
31
-
32
-
33
-
34
-
35
-
36
-
37
-
38
-
39
-
40
-
41
-
42
-
43
-
44
-
45
-
46
-
47
-
48
-
49
-
50
-
51
-
52
-
53
-
54
-
55
-
56
-
57
-
58
-
59
-
60
-
61
-
62
-
63
-
64
-
65
-
66
-
67
-
68
-
69
-
70
-
71
-
72
-
73
-
74
-
75
-
76
-
77
-
78
-
79
-
80
-
81
-
82
-
83
-
84
-
85
-
86
-
87
-
88
-
89
-
90
-
91
-
92
-
93
-
94
-
95
-
96
-
97
-
98
-
99
-
 100
100 -
 101
101 -
 102
102 -
 103
103 -
 104
104 -
 105
105 -
 106
106 -
 107
107 -
 108
108 -
 109
109 -
 110
110 -
 111
111 -
 112
112 -
 113
113 -
 114
114 -
 115
115 -
 116
116 -
 117
117 -
 118
118 -
 119
119 -
 120
120 -
121
-
122
-
123
-
124
-
125
-
126
-
127
-
128
-
129
-
130
-
131
-
132
-
133
-
134
-
135
-
136
-
137
-
138
-
139
-
140
-
141
-
142
-
143
-
144
-
145
-
146
-
147
-
148
-
149
-
150
-
151
-
152
-
153
-
154
-
155
-
156
-
157
-
158
-
159
-
160
-
161
-
162
-
163
-
164
-
165
-
166
-
167
-
168
-
169
-
170
-
171
-
172
 |
 |

agencies and a majority of its short-term investments in commercial paper is determined using observable market-
based inputs for similar assets, which primarily include yield curves and time-to-maturity factors. Such investments
are therefore considered to be Level 2 items. The fair value of the Company’s investment in asset-backed
commercial paper prior to its complete sale in the second quarter of 2010 was determined using primarily
unobservable inputs that could not be corroborated by market data, primarily consisting of indicative bids from
potential purchasers, and was therefore considered to be a Level 3 item.
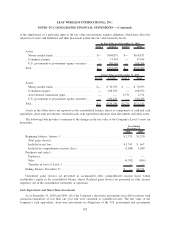
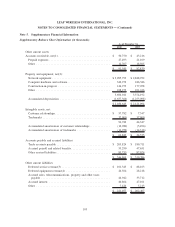
Available-for-sale securities were comprised as follows as of December 31, 2010 and 2009 (in thousands):
Cost Fair Value
As of December 31, 2010
Money market funds .......................................... $168,831 $168,831
Commercial paper ............................................ 17,494 17,494
U.S. government or government agency securities .................... 108,364 108,364
$294,689 $294,689
Cost Fair Value
As of December 31, 2009
Money market funds .......................................... $ 70,393 $ 70,393
Commercial paper ............................................ 108,955 108,952
Asset-backed commercial paper .................................. 1,051 2,731
U.S. government or government agency securities .................... 350,402 350,435
$530,801 $532,511
Long-Term Debt
The Company continues to report its long-term debt obligations at amortized cost; however, for disclosure
purposes, the Company is required to measure the fair value of outstanding debt on a recurring basis. The fair value
of the Company’s outstanding long-term debt is determined primarily by using quoted prices in active markets and
was $2,876.8 million and $2,715.7 million as of December 31, 2010 and 2009, respectively.
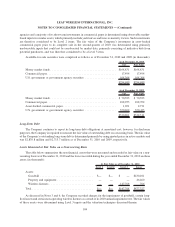
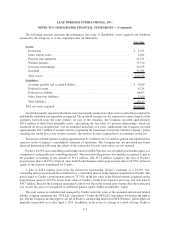
Assets Measured at Fair Value on a Nonrecurring Basis
The table below summarizes the non-financial assets that were measured and recorded at fair value on a non-
recurring basis as of December 31, 2010 and the losses recorded during the year ended December 31, 2010 on those
assets (in thousands):
Level 1 Level 2 Level 3 Losses
At Fair Value as of December 31, 2010
Assets:
Goodwill .................................. $— $— $ — $430,101
Property and equipment ....................... — — — 46,460
Wireless licenses ............................ — — 147,768 766
Total....................................... $— $— $147,768 $477,327
As discussed in Notes 3 and 6, the Company recorded charges for the impairment of goodwill, certain long-
lived assets and certain non-operating wireless licenses as a result of its 2010 annual impairment test. The fair values
of these assets were determined using Level 3 inputs and the valuation techniques discussed therein.
104
LEAP WIRELESS INTERNATIONAL, INC.
NOTES TO CONSOLIDATED FINANCIAL STATEMENTS — (Continued)