Cricket Wireless 2010 Annual Report Download - page 108
Download and view the complete annual report
Please find page 108 of the 2010 Cricket Wireless annual report below. You can navigate through the pages in the report by either clicking on the pages listed below, or by using the keyword search tool below to find specific information within the annual report.-
 1
1 -
2
-
3
-
4
-
5
-
6
-
7
-
8
-
9
-
10
-
11
-
12
-
13
-
14
-
15
-
16
-
17
-
18
-
19
-
20
-
21
-
22
-
23
-
24
-
25
-
26
-
27
-
28
-
29
-
30
-
31
-
32
-
33
-
34
-
35
-
36
-
37
-
38
-
39
-
40
-
41
-
42
-
43
-
44
-
45
-
46
-
47
-
48
-
49
-
50
-
51
-
52
-
53
-
54
-
55
-
56
-
57
-
58
-
59
-
60
-
61
-
62
-
63
-
64
-
65
-
66
-
67
-
68
-
69
-
70
-
71
-
72
-
73
-
74
-
75
-
76
-
77
-
78
-
79
-
80
-
81
-
82
-
83
-
84
-
85
-
86
-
87
-
88
-
89
-
90
-
91
-
92
-
93
-
94
-
95
-
96
-
97
-
 98
98 -
 99
99 -
 100
100 -
 101
101 -
 102
102 -
 103
103 -
 104
104 -
 105
105 -
 106
106 -
 107
107 -
 108
108 -
 109
109 -
 110
110 -
 111
111 -
 112
112 -
 113
113 -
 114
114 -
 115
115 -
 116
116 -
 117
117 -
 118
118 -
119
-
120
-
121
-
122
-
123
-
124
-
125
-
126
-
127
-
128
-
129
-
130
-
131
-
132
-
133
-
134
-
135
-
136
-
137
-
138
-
139
-
140
-
141
-
142
-
143
-
144
-
145
-
146
-
147
-
148
-
149
-
150
-
151
-
152
-
153
-
154
-
155
-
156
-
157
-
158
-
159
-
160
-
161
-
162
-
163
-
164
-
165
-
166
-
167
-
168
-
169
-
170
-
171
-
172
 |
 |
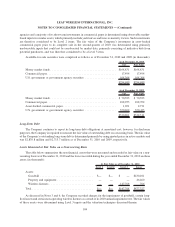
Basic and Diluted Earnings (Loss) Per Share
Basic earnings (loss) per share is computed by dividing net income (loss) available to common stockholders by
the weighted-average number of common shares outstanding during the period. Diluted earnings per share is
computed by dividing net income available to common stockholders by the sum of the weighted-average number of
common shares outstanding during the period and the weighted-average number of dilutive common share
equivalents outstanding during the period, using the treasury stock method and the if-converted method, where
applicable. Dilutive common share equivalents are comprised of stock options, restricted stock awards, employee
stock purchase rights and convertible senior notes. Since the Company incurred losses for the years ended
December 31, 2010, 2009 and 2008, 9.4 million, 9.3 million and 9.1 million common share equivalents were
excluded in the computation of diluted loss per share for those periods, respectively.
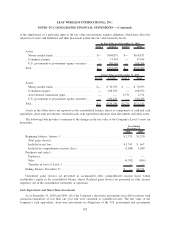
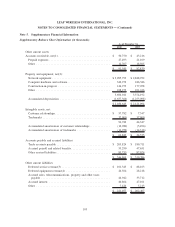
Note 4. Fair Value Measurements
The Company has categorized its assets and liabilities measured at fair value into a three-level hierarchy in
accordance with the authoritative guidance for fair value measurements. Assets and liabilities measured at fair value
using quoted prices in active markets for identical assets or liabilities are generally categorized as Level 1; assets
and liabilities measured at fair value using observable market-based inputs or unobservable inputs that are
corroborated by market data for similar assets or liabilities are generally categorized as Level 2; and assets
and liabilities measured at fair value using unobservable inputs that cannot be corroborated by market data are
generally categorized as Level 3. Assets and liabilities presented at fair value in the Company’s consolidated
balance sheets are generally categorized as follows:
Level 1 Quoted prices in active markets for identical assets or liabilities. The Company did not have any Level 1
assets or liabilities as of December 31, 2010 or 2009.
Level 2 Observable inputs other than Level 1 prices, such as quoted prices for similar assets or liabilities, quoted
prices in markets that are not active or other inputs that are observable or can be corroborated by observable
market data for substantially the full term of the assets or liabilities. The Company’s Level 2 assets as of
December 31, 2010 and 2009 included its cash equivalents, its short-term investments in obligations of the
U.S. government and government agencies and a majority of its short-term investments in commercial
paper.
Level 3 Unobservable inputs that are supported by little or no market activity and that are significant to the fair
value of the assets or liabilities. Such assets and liabilities may have values determined using pricing
models, discounted cash flow methodologies, or similar techniques, and include instruments for which the
determination of fair value requires significant management judgment or estimation. The Company’s
Level 3 asset as of December 31, 2009 was a short-term investment in asset-backed commercial paper. The
Company did not have any Level 3 assets or liabilities as of December 31, 2010.
The following tables set forth by level within the fair value hierarchy the Company’s assets and liabilities that
were recorded at fair value as of December 31, 2010 and 2009 (in thousands). As required by the guidance for fair
value measurements, financial assets and liabilities are classified in their entirety based on the lowest level of input
that is significant to the fair value measurement. Thus, assets and liabilities categorized as Level 3 may be measured
at fair value using inputs that are observable (Levels 1 and 2) and unobservable (Level 3). Management’s assessment
102
LEAP WIRELESS INTERNATIONAL, INC.
NOTES TO CONSOLIDATED FINANCIAL STATEMENTS — (Continued)