Cricket Wireless 2010 Annual Report Download - page 70
Download and view the complete annual report
Please find page 70 of the 2010 Cricket Wireless annual report below. You can navigate through the pages in the report by either clicking on the pages listed below, or by using the keyword search tool below to find specific information within the annual report.-
 1
1 -
2
-
3
-
4
-
5
-
6
-
7
-
8
-
9
-
10
-
11
-
12
-
13
-
14
-
15
-
16
-
17
-
18
-
19
-
20
-
21
-
22
-
23
-
24
-
25
-
26
-
27
-
28
-
29
-
30
-
31
-
32
-
33
-
34
-
35
-
36
-
37
-
38
-
39
-
40
-
41
-
42
-
43
-
44
-
45
-
46
-
47
-
48
-
49
-
50
-
51
-
52
-
53
-
54
-
55
-
56
-
57
-
58
-
59
-
 60
60 -
 61
61 -
 62
62 -
 63
63 -
 64
64 -
 65
65 -
 66
66 -
 67
67 -
 68
68 -
 69
69 -
 70
70 -
 71
71 -
 72
72 -
 73
73 -
 74
74 -
 75
75 -
 76
76 -
 77
77 -
 78
78 -
 79
79 -
 80
80 -
81
-
82
-
83
-
84
-
85
-
86
-
87
-
88
-
89
-
90
-
91
-
92
-
93
-
94
-
95
-
96
-
97
-
98
-
99
-
100
-
101
-
102
-
103
-
104
-
105
-
106
-
107
-
108
-
109
-
110
-
111
-
112
-
113
-
114
-
115
-
116
-
117
-
118
-
119
-
120
-
121
-
122
-
123
-
124
-
125
-
126
-
127
-
128
-
129
-
130
-
131
-
132
-
133
-
134
-
135
-
136
-
137
-
138
-
139
-
140
-
141
-
142
-
143
-
144
-
145
-
146
-
147
-
148
-
149
-
150
-
151
-
152
-
153
-
154
-
155
-
156
-
157
-
158
-
159
-
160
-
161
-
162
-
163
-
164
-
165
-
166
-
167
-
168
-
169
-
170
-
171
-
172
 |
 |

During the year ended December 31, 2009, we completed the exchange of certain wireless spectrum with
MetroPCS. We recognized a non-monetary net gain of approximately $4.4 million upon the closing of the
transaction. This net gain was more than offset by approximately $4.7 million in losses we recognized upon the
disposal of certain of our property and equipment during the year ended December 31, 2009.
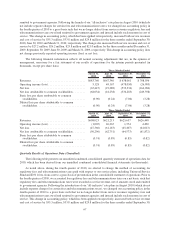
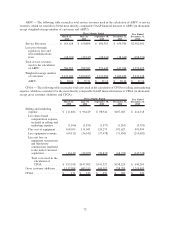
Non-Operating Items
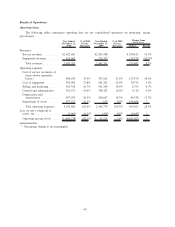
The following tables summarize non-operating data for our consolidated operations (in thousands).
2010 2009 Change
Year Ended December 31,
Equity in net income (loss) of investees, net ................. 1,912 3,946 (2,034)
Interest income ...................................... 1,010 3,806 (2,796)
Interest expense ...................................... (243,377) (210,389) (32,988)
Other income (expense), net ............................. 3,209 469 2,740
Loss on extinguishment of debt .......................... (54,558) (26,310) (28,248)
Income tax expense ................................... (42,513) (40,609) (1,904)
2009 2008 Change
Year Ended December 31,
Equity in net income (loss) of investees, net ................. 3,946 (298) 4,244
Interest income ...................................... 3,806 14,571 (10,765)
Interest expense ...................................... (210,389) (158,259) (52,130)
Other income (expense), net ............................. 469 (7,125) 7,594
Loss on extinguishment of debt .......................... (26,310) — (26,310)
Income tax expense ................................... (40,609) (38,970) (1,639)
Equity in Net Income (Loss) of Investees, Net
Equity in net income (loss) of investees, net reflects our share of net income (and net losses) of regional
wireless service providers in which we hold investments.
Interest Income
Interest income decreased $2.8 million during the year ended December 31, 2010 compared to the
corresponding period of the prior year. This decrease was primarily attributable to a decline in short-term
interest rates from the corresponding period of the prior year.
Interest income decreased $10.8 million during the year ended December 31, 2009 compared to the
corresponding period of the prior year. This decrease was primarily attributable to a decline in short-term
interest rates from the corresponding period of the prior year.
Interest Expense
Interest expense increased $33.0 million during the year ended December 31, 2010 compared to the
corresponding period of the prior year. The increase in interest expense resulted primarily from the fact that
we did not capitalize interest during the year ended December 31, 2010, compared to $20.8 million of interest
capitalized during the corresponding period of the prior year. We also incurred a full year of interest expense during
2010 from our $1,100 million of senior secured notes issued in June 2009 as well as additional interest expense from
our issuance of $1,200 million of unsecured senior notes in November 2010.
Interest expense increased $52.1 million during the year ended December 31, 2009 compared to the
corresponding period of the prior year. The increase in interest expense resulted primarily from our issuance of
$300 million of unsecured senior notes and $250 million of convertible senior notes in June 2008 and our issuance
of $1,100 million of senior secured notes in June 2009. We capitalized $20.8 million of interest during the year
64