Comcast 2014 Annual Report Download - page 84
Download and view the complete annual report
Please find page 84 of the 2014 Comcast annual report below. You can navigate through the pages in the report by either clicking on the pages listed below, or by using the keyword search tool below to find specific information within the annual report.-
 1
1 -
2
-
3
-
4
-
5
-
6
-
7
-
8
-
9
-
10
-
11
-
12
-
13
-
14
-
15
-
16
-
17
-
18
-
19
-
20
-
21
-
22
-
23
-
24
-
25
-
26
-
27
-
28
-
29
-
30
-
31
-
32
-
33
-
34
-
35
-
36
-
37
-
38
-
39
-
40
-
41
-
42
-
43
-
44
-
45
-
46
-
47
-
48
-
49
-
50
-
51
-
52
-
53
-
54
-
55
-
56
-
57
-
58
-
59
-
60
-
61
-
62
-
63
-
64
-
65
-
66
-
67
-
68
-
69
-
70
-
71
-
72
-
73
-
 74
74 -
 75
75 -
 76
76 -
 77
77 -
 78
78 -
 79
79 -
 80
80 -
 81
81 -
 82
82 -
 83
83 -
 84
84 -
 85
85 -
 86
86 -
 87
87 -
 88
88 -
 89
89 -
 90
90 -
 91
91 -
 92
92 -
 93
93 -
 94
94 -
95
-
96
-
97
-
98
-
99
-
100
-
101
-
102
-
103
-
104
-
105
-
106
-
107
-
108
-
109
-
110
-
111
-
112
-
113
-
114
-
115
-
116
-
117
-
118
-
119
-
120
-
121
-
122
-
123
-
124
-
125
-
126
-
127
-
128
-
129
-
130
-
131
-
132
-
133
-
134
-
135
-
136
-
137
-
138
-
139
-
140
-
141
-
142
-
143
-
144
-
145
-
146
-
147
-
148
-
149
-
150
-
151
-
152
-
153
-
154
-
155
-
156
-
157
-
158
-
159
-
160
-
161
-
162
-
163
-
164
-
165
-
166
-
167
-
168
-
169
-
170
-
171
-
172
-
173
-
174
-
175
-
176
-
177
-
178
-
179
-
180
-
181
-
182
-
183
-
184
-
185
-
186
-
187
-
188
-
189
-
190
-
191
-
192
-
193
-
194
-
195
-
196
-
197
-
198
-
199
-
200
-
201
-
202
-
203
-
204
-
205
-
206
-
207
-
208
-
209
-
210
-
211
-
212
-
213
-
214
-
215
-
216
-
217
-
218
-
219
-
220
-
221
-
222
-
223
-
224
-
225
-
226
-
227
-
228
-
229
-
230
-
231
-
232
-
233
-
234
-
235
-
236
-
237
-
238
-
239
-
240
-
241
-
242
-
243
-
244
-
245
-
246
-
247
-
248
-
249
-
250
-
251
-
252
-
253
-
254
-
255
-
256
-
257
-
258
-
259
-
260
-
261
-
262
-
263
-
264
-
265
-
266
-
267
-
268
-
269
-
270
-
271
-
272
-
273
-
274
-
275
-
276
-
277
-
278
-
279
-
280
-
281
-
282
-
283
-
284
-
285
-
286
-
287
-
288
-
289
-
290
-
291
-
292
-
293
-
294
-
295
-
296
-
297
-
298
-
299
-
300
-
301
-
302
-
303
-
304
-
305
-
306
-
307
-
308
-
309
-
310
-
311
-
312
-
313
-
314
-
315
-
316
-
317
-
318
-
319
-
320
-
321
-
322
-
323
-
324
-
325
-
326
-
327
-
328
-
329
-
330
-
331
-
332
-
333
-
334
-
335
-
336
-
337
-
338
-
339
-
340
-
341
-
342
-
343
-
344
-
345
-
346
-
347
-
348
-
349
-
350
-
351
-
352
-
353
-
354
-
355
-
356
-
357
-
358
-
359
-
360
-
361
-
362
-
363
-
364
-
365
-
366
-
367
-
368
-
369
-
370
-
371
-
372
-
373
-
374
-
375
-
376
-
377
-
378
-
379
-
380
-
381
-
382
-
383
-
384
-
385
-
386
 |
 |

Table of Contents
Item 7A: Quantitative and Qualitative Disclosures About Market Risk
Interest Rate Risk Management
We maintain a mix of fixed-rate and variable-
rate debt and we are exposed to the market risk of adverse changes in interest rates.
In order to manage the cost and volatility relating to the interest cost of our outstanding debt, we enter into various interest rate risk
management derivative transactions in accordance with our policies.
We monitor our exposure to the risk of adverse changes in interest rates through the use of techniques that include market value
and sensitivity analyses. We do not engage in any speculative or leveraged derivative transactions.
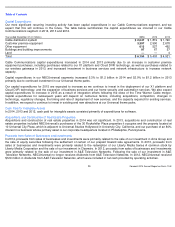
Our interest rate derivative financial instruments, which may include swaps, rate locks, caps and collars, represent an integral part
of our interest rate risk management program. Comcast’
s interest rate derivative financial instruments reduced the portion of
Comcast’s total consolidated debt at fixed rates as of December 31, 2014 to 88.7% from 95.2%. NBCUniversal’
s interest rate
derivative financial instruments reduced the portion of NBCUniversal’
s total consolidated debt at fixed rates as of December 31,
2014 to 95.5% from 99.9%.
In 2014, 2013 and 2012, the effect of our interest rate derivative financial instruments was to decrease Comcast’
s consolidated
interest expense by $66 million, $98 million and $106 million, respectively. The effect of NBCUniversal’
s interest rate derivative
financial instruments was not material to NBCUniversal’
s consolidated financial statements for all periods presented. Interest rate
derivative financial instruments may have a significant effect on Comcast’s interest expense in the future.
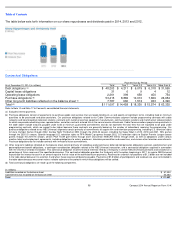
The table below summarizes as of December 31, 2014 the fair values and contract terms of financial instruments by contractual
year of maturity subject to interest rate risk maintained by us.
The estimated fair value of our interest rate swaps in the table above includes $11 million associated with interest rate swaps held
by NBCUniversal.
We use the notional amount of each interest rate derivative financial instrument to calculate the interest to be paid or received. The
notional amounts do not represent our exposure to credit loss. The estimated fair value approximates the amount of payments to be
made or proceeds to be received to settle the outstanding contracts, including accrued interest. We estimate interest rates on
variable rate debt and swaps using the average implied forward London Interbank Offered Rate through the year of maturity based
on the yield curve in effect on December 31, 2014, plus the applicable borrowing margin on December 31, 2014.
(in millions)
2015
2016
2017
2018
2019
Thereafter
Total
Estimated
Fair Value as of
December 31,
2014
Debt
Fixed rate
$
3,358
$
2,793
$
2,558
$
3,417
$
2,205
$
31,607
$
45,938
$
53,019
Average interest rate
6.0
%
4.6
%
7.0
%
4.3
%
3.2
%
5.4
%
5.3
%
Variable rate
$
859
$
737
$
—
$
700
$
—
$
—
$
2,296
$
2,301
Average interest rate
1.2
%
2.5
%
0.0
%
3.2
%
0.0
%
0.0
%
0.7
%
Interest Rate Instruments
Fixed to variable swaps
$
150
$
800
$
400
$
1,600
$
200
$
—
$
3,150
$
99
Average pay rate
1.8
%
2.9
%
6.1
%
4.5
%
5.1
%
0.0
%
3.4
%
Average receive rate
3.7
%
4.8
%
6.3
%
5.8
%
5.7
%
0.0
%
5.5
%
79
Comcast 2014 Annual Report on Form 10
-
K