Comcast 2014 Annual Report Download - page 73
Download and view the complete annual report
Please find page 73 of the 2014 Comcast annual report below. You can navigate through the pages in the report by either clicking on the pages listed below, or by using the keyword search tool below to find specific information within the annual report.-
 1
1 -
2
-
3
-
4
-
5
-
6
-
7
-
8
-
9
-
10
-
11
-
12
-
13
-
14
-
15
-
16
-
17
-
18
-
19
-
20
-
21
-
22
-
23
-
24
-
25
-
26
-
27
-
28
-
29
-
30
-
31
-
32
-
33
-
34
-
35
-
36
-
37
-
38
-
39
-
40
-
41
-
42
-
43
-
44
-
45
-
46
-
47
-
48
-
49
-
50
-
51
-
52
-
53
-
54
-
55
-
56
-
57
-
58
-
59
-
60
-
61
-
62
-
 63
63 -
 64
64 -
 65
65 -
 66
66 -
 67
67 -
 68
68 -
 69
69 -
 70
70 -
 71
71 -
 72
72 -
 73
73 -
 74
74 -
 75
75 -
 76
76 -
 77
77 -
 78
78 -
 79
79 -
 80
80 -
 81
81 -
 82
82 -
 83
83 -
84
-
85
-
86
-
87
-
88
-
89
-
90
-
91
-
92
-
93
-
94
-
95
-
96
-
97
-
98
-
99
-
100
-
101
-
102
-
103
-
104
-
105
-
106
-
107
-
108
-
109
-
110
-
111
-
112
-
113
-
114
-
115
-
116
-
117
-
118
-
119
-
120
-
121
-
122
-
123
-
124
-
125
-
126
-
127
-
128
-
129
-
130
-
131
-
132
-
133
-
134
-
135
-
136
-
137
-
138
-
139
-
140
-
141
-
142
-
143
-
144
-
145
-
146
-
147
-
148
-
149
-
150
-
151
-
152
-
153
-
154
-
155
-
156
-
157
-
158
-
159
-
160
-
161
-
162
-
163
-
164
-
165
-
166
-
167
-
168
-
169
-
170
-
171
-
172
-
173
-
174
-
175
-
176
-
177
-
178
-
179
-
180
-
181
-
182
-
183
-
184
-
185
-
186
-
187
-
188
-
189
-
190
-
191
-
192
-
193
-
194
-
195
-
196
-
197
-
198
-
199
-
200
-
201
-
202
-
203
-
204
-
205
-
206
-
207
-
208
-
209
-
210
-
211
-
212
-
213
-
214
-
215
-
216
-
217
-
218
-
219
-
220
-
221
-
222
-
223
-
224
-
225
-
226
-
227
-
228
-
229
-
230
-
231
-
232
-
233
-
234
-
235
-
236
-
237
-
238
-
239
-
240
-
241
-
242
-
243
-
244
-
245
-
246
-
247
-
248
-
249
-
250
-
251
-
252
-
253
-
254
-
255
-
256
-
257
-
258
-
259
-
260
-
261
-
262
-
263
-
264
-
265
-
266
-
267
-
268
-
269
-
270
-
271
-
272
-
273
-
274
-
275
-
276
-
277
-
278
-
279
-
280
-
281
-
282
-
283
-
284
-
285
-
286
-
287
-
288
-
289
-
290
-
291
-
292
-
293
-
294
-
295
-
296
-
297
-
298
-
299
-
300
-
301
-
302
-
303
-
304
-
305
-
306
-
307
-
308
-
309
-
310
-
311
-
312
-
313
-
314
-
315
-
316
-
317
-
318
-
319
-
320
-
321
-
322
-
323
-
324
-
325
-
326
-
327
-
328
-
329
-
330
-
331
-
332
-
333
-
334
-
335
-
336
-
337
-
338
-
339
-
340
-
341
-
342
-
343
-
344
-
345
-
346
-
347
-
348
-
349
-
350
-
351
-
352
-
353
-
354
-
355
-
356
-
357
-
358
-
359
-
360
-
361
-
362
-
363
-
364
-
365
-
366
-
367
-
368
-
369
-
370
-
371
-
372
-
373
-
374
-
375
-
376
-
377
-
378
-
379
-
380
-
381
-
382
-
383
-
384
-
385
-
386
 |
 |

Table of Contents
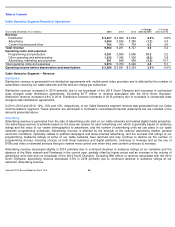
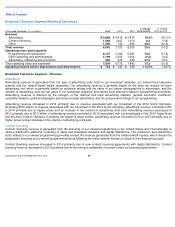
Theme Parks Segment Results of Operations
Theme Parks Segment – Revenue
Our Theme Parks segment revenue is generated primarily from theme park attendance and per capita spending at our Universal
theme parks in Orlando, Florida and Hollywood, California, as well as from licensing and other fees. Attendance at our theme parks
and per capita spending depend heavily on the general environment for travel and tourism, including consumer spending on travel
and other recreational activities. Licensing and other fees relate primarily to our agreements with third parties that operate the
Universal Studios Japan and the Universal Studios Singapore theme parks to license the Universal Studios brand name and other
intellectual property.
Theme Parks segment revenue increased in 2014 and 2013 primarily due to higher guest attendance and increases in per capita
spending at our Orlando and Hollywood theme parks. The increase in 2014 was primarily due to new attractions, such as
The
Wizarding World of Harry Potter™ – Diagon Alley™ in Orlando and Despicable Me: Minion Mayhem
in Hollywood. The increase in
2013 was primarily due to the continued success of The Wizarding World of Harry Potter™
attraction in Orlando and the
Transformers attractions in Orlando and Hollywood.
Theme Parks Segment – Operating Costs and Expenses
Our Theme Parks segment operating costs and expenses consist primarily of theme park operations, including repairs and
maintenance and related administrative expenses; food, beverage and merchandise costs; labor costs; and sales and marketing
costs.
Theme Parks segment operating costs and expenses increased in 2014 and 2013 primarily due to additional costs at our Orlando
and Hollywood theme parks associated with new attractions, such as The Wizarding World of Harry Potter™ – Diagon Alley™
in
Orlando in 2014 and increases in food, beverage and merchandise costs associated with the increases in attendance in both
periods.
NBCUniversal Headquarters, Other and Eliminations
Headquarters and Other operating costs and expenses incurred by our NBCUniversal businesses include overhead, personnel
costs and costs associated with corporate initiatives. Operating costs and expenses increased in 2014 and 2013 primarily due to
higher employee-related costs, including severance costs in 2014.
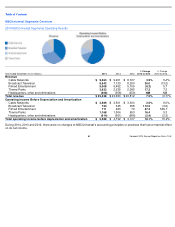
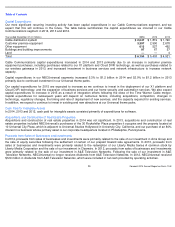
Corporate and Other Results of Operations
Year ended December 31 (in millions)
2014
2013
2012
% Change
2013 to 2014
% Change
2012 to 2013
Revenue
$
2,623
$
2,235
$
2,085
17.3
%
7.2
%
Operating costs and expenses
1,455
1,231
1,132
18.1
8.8
Operating income before depreciation and amortization
$
1,168
$
1,004
$
953
16.4
%
5.3
%
Year ended December 31 (in millions)
2014
2013
2012
% Change
2013 to 2014
% Change
2012 to 2013
Revenue
$
709
$
600
$
498
18.1
%
20.6
%
Operating costs and expenses
1,487
1,089
874
36.5
24.7
Operating loss before depreciation and amortization
$
(778
)
$
(489
)
$
(376
)
(59.1
)%
(30.2
)%
Comcast 2014 Annual Report on Form 10
-
K
68