Comcast 2014 Annual Report Download - page 77
Download and view the complete annual report
Please find page 77 of the 2014 Comcast annual report below. You can navigate through the pages in the report by either clicking on the pages listed below, or by using the keyword search tool below to find specific information within the annual report.-
 1
1 -
2
-
3
-
4
-
5
-
6
-
7
-
8
-
9
-
10
-
11
-
12
-
13
-
14
-
15
-
16
-
17
-
18
-
19
-
20
-
21
-
22
-
23
-
24
-
25
-
26
-
27
-
28
-
29
-
30
-
31
-
32
-
33
-
34
-
35
-
36
-
37
-
38
-
39
-
40
-
41
-
42
-
43
-
44
-
45
-
46
-
47
-
48
-
49
-
50
-
51
-
52
-
53
-
54
-
55
-
56
-
57
-
58
-
59
-
60
-
61
-
62
-
63
-
64
-
65
-
66
-
 67
67 -
 68
68 -
 69
69 -
 70
70 -
 71
71 -
 72
72 -
 73
73 -
 74
74 -
 75
75 -
 76
76 -
 77
77 -
 78
78 -
 79
79 -
 80
80 -
 81
81 -
 82
82 -
 83
83 -
 84
84 -
 85
85 -
 86
86 -
 87
87 -
88
-
89
-
90
-
91
-
92
-
93
-
94
-
95
-
96
-
97
-
98
-
99
-
100
-
101
-
102
-
103
-
104
-
105
-
106
-
107
-
108
-
109
-
110
-
111
-
112
-
113
-
114
-
115
-
116
-
117
-
118
-
119
-
120
-
121
-
122
-
123
-
124
-
125
-
126
-
127
-
128
-
129
-
130
-
131
-
132
-
133
-
134
-
135
-
136
-
137
-
138
-
139
-
140
-
141
-
142
-
143
-
144
-
145
-
146
-
147
-
148
-
149
-
150
-
151
-
152
-
153
-
154
-
155
-
156
-
157
-
158
-
159
-
160
-
161
-
162
-
163
-
164
-
165
-
166
-
167
-
168
-
169
-
170
-
171
-
172
-
173
-
174
-
175
-
176
-
177
-
178
-
179
-
180
-
181
-
182
-
183
-
184
-
185
-
186
-
187
-
188
-
189
-
190
-
191
-
192
-
193
-
194
-
195
-
196
-
197
-
198
-
199
-
200
-
201
-
202
-
203
-
204
-
205
-
206
-
207
-
208
-
209
-
210
-
211
-
212
-
213
-
214
-
215
-
216
-
217
-
218
-
219
-
220
-
221
-
222
-
223
-
224
-
225
-
226
-
227
-
228
-
229
-
230
-
231
-
232
-
233
-
234
-
235
-
236
-
237
-
238
-
239
-
240
-
241
-
242
-
243
-
244
-
245
-
246
-
247
-
248
-
249
-
250
-
251
-
252
-
253
-
254
-
255
-
256
-
257
-
258
-
259
-
260
-
261
-
262
-
263
-
264
-
265
-
266
-
267
-
268
-
269
-
270
-
271
-
272
-
273
-
274
-
275
-
276
-
277
-
278
-
279
-
280
-
281
-
282
-
283
-
284
-
285
-
286
-
287
-
288
-
289
-
290
-
291
-
292
-
293
-
294
-
295
-
296
-
297
-
298
-
299
-
300
-
301
-
302
-
303
-
304
-
305
-
306
-
307
-
308
-
309
-
310
-
311
-
312
-
313
-
314
-
315
-
316
-
317
-
318
-
319
-
320
-
321
-
322
-
323
-
324
-
325
-
326
-
327
-
328
-
329
-
330
-
331
-
332
-
333
-
334
-
335
-
336
-
337
-
338
-
339
-
340
-
341
-
342
-
343
-
344
-
345
-
346
-
347
-
348
-
349
-
350
-
351
-
352
-
353
-
354
-
355
-
356
-
357
-
358
-
359
-
360
-
361
-
362
-
363
-
364
-
365
-
366
-
367
-
368
-
369
-
370
-
371
-
372
-
373
-
374
-
375
-
376
-
377
-
378
-
379
-
380
-
381
-
382
-
383
-
384
-
385
-
386
 |
 |

Table of Contents
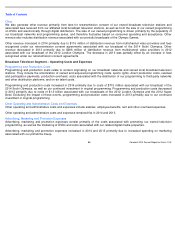
Operating Activities
Components of Net Cash Provided by Operating Activities
The changes in operating assets and liabilities in 2014 compared to the changes in 2013 were primarily related to the timing of film
and television production spending and related costs, net of amortization of approximately $600 million.
The changes in operating assets and liabilities in 2013 compared to the changes in 2012 were primarily due to the timing of receipts
for our accounts receivable, increases in deferred revenue associated with our Olympics broadcasts, and a decrease in film and
television costs. The increases were partially offset by payments made in 2013 related to the termination of a film financing
arrangement and payments of our accounts payable and accrued expenses related to trade creditors, as well as the timing of other
operating items.
Interest payments remained relatively flat in 2014 and 2013.
The decrease in income tax payments in 2014 was primarily due to the settlement of tax disputes and the repatriation of foreign
earnings in 2013. The decrease was partially offset by higher taxable income from operations and the net impact of the economic
stimulus legislation in 2014. The increase in income tax payments in 2013 was primarily due to higher taxable income from
operations, the net impact of the economic stimulus legislation, the settlement of tax disputes and the repatriation of foreign
earnings. We expect income tax payments to increase in 2015 primarily due to higher taxable income from operations and the net
impact of economic stimulus legislation.
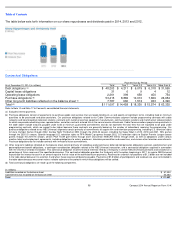
Investing Activities
Net cash used in investing activities in 2014 consisted primarily of cash paid for capital expenditures and intangible assets. Net
cash used in investing activities in 2013 consisted primarily of cash paid for capital expenditures, acquisitions and construction of
real estate properties, purchases of investments and cash paid for intangible assets. Net cash used in investing activities in 2012
consisted primarily of cash paid for capital expenditures, intangible assets and purchases of investments, which was substantially
offset by proceeds from the sale of investments and return of capital from investees.
Year ended December 31 (in millions)
2014
2013
2012
Operating income
$
14,904
$
13,563
$
12,179
Depreciation and amortization
8,019
7,871
7,798
Operating income before depreciation and amortization
22,923
21,434
19,977
Noncash share-based compensation
513
419
371
Termination of receivables monetization programs
—
(
1,442
)
—
Changes in operating assets and liabilities
(357
)
93
(418
)
Cash basis operating income
23,079
20,504
19,930
Payments of interest
(2,389
)
(2,355
)
(2,314
)
Payments of income taxes
(3,668
)
(3,946
)
(2,841
)
Proceeds from investments and other
190
162
213
Excess tax benefits under share
-
based compensation
(267
)
(205
)
(134
)
Net cash provided by operating activities
$
16,945
$
14,160
$
14,854
Comcast 2014 Annual Report on Form 10
-
K
72