Comcast 2014 Annual Report Download - page 70
Download and view the complete annual report
Please find page 70 of the 2014 Comcast annual report below. You can navigate through the pages in the report by either clicking on the pages listed below, or by using the keyword search tool below to find specific information within the annual report.-
 1
1 -
2
-
3
-
4
-
5
-
6
-
7
-
8
-
9
-
10
-
11
-
12
-
13
-
14
-
15
-
16
-
17
-
18
-
19
-
20
-
21
-
22
-
23
-
24
-
25
-
26
-
27
-
28
-
29
-
30
-
31
-
32
-
33
-
34
-
35
-
36
-
37
-
38
-
39
-
40
-
41
-
42
-
43
-
44
-
45
-
46
-
47
-
48
-
49
-
50
-
51
-
52
-
53
-
54
-
55
-
56
-
57
-
58
-
59
-
 60
60 -
 61
61 -
 62
62 -
 63
63 -
 64
64 -
 65
65 -
 66
66 -
 67
67 -
 68
68 -
 69
69 -
 70
70 -
 71
71 -
 72
72 -
 73
73 -
 74
74 -
 75
75 -
 76
76 -
 77
77 -
 78
78 -
 79
79 -
 80
80 -
81
-
82
-
83
-
84
-
85
-
86
-
87
-
88
-
89
-
90
-
91
-
92
-
93
-
94
-
95
-
96
-
97
-
98
-
99
-
100
-
101
-
102
-
103
-
104
-
105
-
106
-
107
-
108
-
109
-
110
-
111
-
112
-
113
-
114
-
115
-
116
-
117
-
118
-
119
-
120
-
121
-
122
-
123
-
124
-
125
-
126
-
127
-
128
-
129
-
130
-
131
-
132
-
133
-
134
-
135
-
136
-
137
-
138
-
139
-
140
-
141
-
142
-
143
-
144
-
145
-
146
-
147
-
148
-
149
-
150
-
151
-
152
-
153
-
154
-
155
-
156
-
157
-
158
-
159
-
160
-
161
-
162
-
163
-
164
-
165
-
166
-
167
-
168
-
169
-
170
-
171
-
172
-
173
-
174
-
175
-
176
-
177
-
178
-
179
-
180
-
181
-
182
-
183
-
184
-
185
-
186
-
187
-
188
-
189
-
190
-
191
-
192
-
193
-
194
-
195
-
196
-
197
-
198
-
199
-
200
-
201
-
202
-
203
-
204
-
205
-
206
-
207
-
208
-
209
-
210
-
211
-
212
-
213
-
214
-
215
-
216
-
217
-
218
-
219
-
220
-
221
-
222
-
223
-
224
-
225
-
226
-
227
-
228
-
229
-
230
-
231
-
232
-
233
-
234
-
235
-
236
-
237
-
238
-
239
-
240
-
241
-
242
-
243
-
244
-
245
-
246
-
247
-
248
-
249
-
250
-
251
-
252
-
253
-
254
-
255
-
256
-
257
-
258
-
259
-
260
-
261
-
262
-
263
-
264
-
265
-
266
-
267
-
268
-
269
-
270
-
271
-
272
-
273
-
274
-
275
-
276
-
277
-
278
-
279
-
280
-
281
-
282
-
283
-
284
-
285
-
286
-
287
-
288
-
289
-
290
-
291
-
292
-
293
-
294
-
295
-
296
-
297
-
298
-
299
-
300
-
301
-
302
-
303
-
304
-
305
-
306
-
307
-
308
-
309
-
310
-
311
-
312
-
313
-
314
-
315
-
316
-
317
-
318
-
319
-
320
-
321
-
322
-
323
-
324
-
325
-
326
-
327
-
328
-
329
-
330
-
331
-
332
-
333
-
334
-
335
-
336
-
337
-
338
-
339
-
340
-
341
-
342
-
343
-
344
-
345
-
346
-
347
-
348
-
349
-
350
-
351
-
352
-
353
-
354
-
355
-
356
-
357
-
358
-
359
-
360
-
361
-
362
-
363
-
364
-
365
-
366
-
367
-
368
-
369
-
370
-
371
-
372
-
373
-
374
-
375
-
376
-
377
-
378
-
379
-
380
-
381
-
382
-
383
-
384
-
385
-
386
 |
 |

Table of Contents
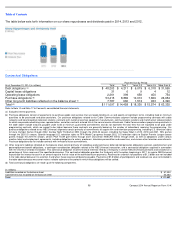
Other
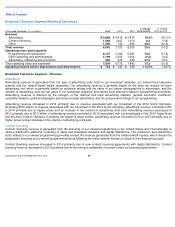
We also generate other revenue primarily from fees for retransmission consent of our owned broadcast television stations and
associated fees received from our affiliated local broadcast television stations, as well as from the sale of our owned programming
on DVDs and electronically through digital distributors. The sale of our owned programming is driven primarily by the popularity of
our broadcast networks and programming series, and therefore fluctuates based on consumer spending and acceptance. Other
revenue also includes distribution revenue associated with our periodic broadcasts of the Olympic Games.
Other revenue increased in 2014 primarily due to $116 million of distribution revenue from multichannel video providers and fees
recognized under our retransmission consent agreements associated with our broadcast of the 2014 Sochi Olympics. Other
revenue decreased in 2013 primarily due to $266 million of distribution revenue from multichannel video providers in 2012
associated with our broadcast of the 2012 London Olympics. The decrease in 2013 was partially offset by an increase in fees
recognized under our retransmission consent agreements.
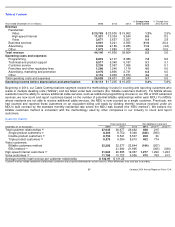
Broadcast Television Segment – Operating Costs and Expenses
Programming and Production Costs
Programming and production costs relate to content originating on our broadcast networks and owned local broadcast television
stations. They include the amortization of owned and acquired programming costs, sports rights, direct production costs, residual
and participation payments, production overhead, costs associated with the distribution of our programming to third-
party networks
and other distribution platforms, and on-air talent costs.
Programming and production costs increased in 2014 primarily due to costs of $715 million associated with our broadcast of the
2014 Sochi Olympics, as well as our continued investment in original programming. Programming and production costs decreased
in 2013 primarily due to costs of $1.3 billion associated with our broadcasts of the 2012 London Olympics and the 2012 Super
Bowl. Excluding the impact of these events, programming and production costs increased in 2013 primarily due to our continued
investment in original programming.
Other Operating and Administrative Costs and Expenses
Other operating and administrative costs and expenses include salaries, employee benefits, rent and other overhead expenses.
Other operating and administrative costs and expenses remained flat in 2014 and 2013.
Advertising, Marketing and Promotion Expenses
Advertising, marketing and promotion expenses consist primarily of the costs associated with promoting our owned television
programming, as well as the marketing of DVDs and costs associated with our related digital media properties.
Advertising, marketing and promotion expenses increased in 2014 and 2013 primarily due to increased spending on marketing
associated with our primetime lineup.
65
Comcast 2014 Annual Report on Form 10-
K