Comcast 2014 Annual Report Download - page 63
Download and view the complete annual report
Please find page 63 of the 2014 Comcast annual report below. You can navigate through the pages in the report by either clicking on the pages listed below, or by using the keyword search tool below to find specific information within the annual report.-
 1
1 -
2
-
3
-
4
-
5
-
6
-
7
-
8
-
9
-
10
-
11
-
12
-
13
-
14
-
15
-
16
-
17
-
18
-
19
-
20
-
21
-
22
-
23
-
24
-
25
-
26
-
27
-
28
-
29
-
30
-
31
-
32
-
33
-
34
-
35
-
36
-
37
-
38
-
39
-
40
-
41
-
42
-
43
-
44
-
45
-
46
-
47
-
48
-
49
-
50
-
51
-
52
-
 53
53 -
 54
54 -
 55
55 -
 56
56 -
 57
57 -
 58
58 -
 59
59 -
 60
60 -
 61
61 -
 62
62 -
 63
63 -
 64
64 -
 65
65 -
 66
66 -
 67
67 -
 68
68 -
 69
69 -
 70
70 -
 71
71 -
 72
72 -
 73
73 -
74
-
75
-
76
-
77
-
78
-
79
-
80
-
81
-
82
-
83
-
84
-
85
-
86
-
87
-
88
-
89
-
90
-
91
-
92
-
93
-
94
-
95
-
96
-
97
-
98
-
99
-
100
-
101
-
102
-
103
-
104
-
105
-
106
-
107
-
108
-
109
-
110
-
111
-
112
-
113
-
114
-
115
-
116
-
117
-
118
-
119
-
120
-
121
-
122
-
123
-
124
-
125
-
126
-
127
-
128
-
129
-
130
-
131
-
132
-
133
-
134
-
135
-
136
-
137
-
138
-
139
-
140
-
141
-
142
-
143
-
144
-
145
-
146
-
147
-
148
-
149
-
150
-
151
-
152
-
153
-
154
-
155
-
156
-
157
-
158
-
159
-
160
-
161
-
162
-
163
-
164
-
165
-
166
-
167
-
168
-
169
-
170
-
171
-
172
-
173
-
174
-
175
-
176
-
177
-
178
-
179
-
180
-
181
-
182
-
183
-
184
-
185
-
186
-
187
-
188
-
189
-
190
-
191
-
192
-
193
-
194
-
195
-
196
-
197
-
198
-
199
-
200
-
201
-
202
-
203
-
204
-
205
-
206
-
207
-
208
-
209
-
210
-
211
-
212
-
213
-
214
-
215
-
216
-
217
-
218
-
219
-
220
-
221
-
222
-
223
-
224
-
225
-
226
-
227
-
228
-
229
-
230
-
231
-
232
-
233
-
234
-
235
-
236
-
237
-
238
-
239
-
240
-
241
-
242
-
243
-
244
-
245
-
246
-
247
-
248
-
249
-
250
-
251
-
252
-
253
-
254
-
255
-
256
-
257
-
258
-
259
-
260
-
261
-
262
-
263
-
264
-
265
-
266
-
267
-
268
-
269
-
270
-
271
-
272
-
273
-
274
-
275
-
276
-
277
-
278
-
279
-
280
-
281
-
282
-
283
-
284
-
285
-
286
-
287
-
288
-
289
-
290
-
291
-
292
-
293
-
294
-
295
-
296
-
297
-
298
-
299
-
300
-
301
-
302
-
303
-
304
-
305
-
306
-
307
-
308
-
309
-
310
-
311
-
312
-
313
-
314
-
315
-
316
-
317
-
318
-
319
-
320
-
321
-
322
-
323
-
324
-
325
-
326
-
327
-
328
-
329
-
330
-
331
-
332
-
333
-
334
-
335
-
336
-
337
-
338
-
339
-
340
-
341
-
342
-
343
-
344
-
345
-
346
-
347
-
348
-
349
-
350
-
351
-
352
-
353
-
354
-
355
-
356
-
357
-
358
-
359
-
360
-
361
-
362
-
363
-
364
-
365
-
366
-
367
-
368
-
369
-
370
-
371
-
372
-
373
-
374
-
375
-
376
-
377
-
378
-
379
-
380
-
381
-
382
-
383
-
384
-
385
-
386
 |
 |

Table of Contents
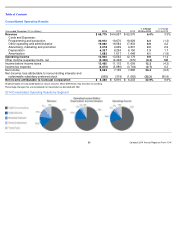
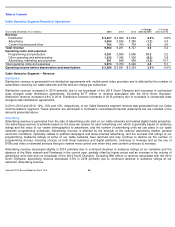
Cable Communications Segment – Revenue
Our Cable Communications segment leverages our existing cable distribution system to grow revenue by, among other things,
adding new customers, encouraging existing cable customers to add new or higher-
tier services, and expanding our other services
such as our business services offerings and our home security and automation services. We offer our cable services in bundles and
often provide promotional incentives. We seek to balance promotional offers and rate increases with their expected effects on the
number of customers and overall revenue.
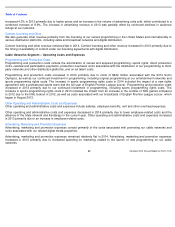
Video
Video revenue increased 1.2% and 2.9% in 2014 and 2013, respectively. The increases in revenue in both years were due to
increases in the number of customers receiving additional and higher levels of video service and rate adjustments, partially offset
by decreases in the number of residential video customers. The increases in customers receiving additional and higher levels of
video service accounted for increases in revenue of 2.7% and 4.7% in 2014 and 2013, respectively. As of December 31, 2014,
13.0 million customers subscribed to at least one of our HD or DVR advanced services compared to 12.5 million customers and
11.8 million customers as of December 31, 2013 and 2012, respectively. While we had rate adjustments in both 2014 and 2013,
rate adjustments were not as significant in 2014 compared to 2013. The decrease in the number of residential video customers in
2014 and 2013 was primarily due to competitive pressures in our service areas from phone and DBS competitors, and the impact of
rate adjustments.
As of December 31, 2014, 40.9% of the homes and businesses in the areas we serve subscribed to our video services, compared
to 41.9% and 43.0% as of December 31, 2013 and 2012, respectively. We may experience further declines in the number of
residential video customers.
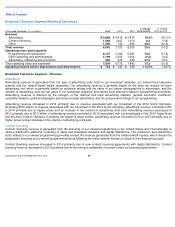
High-Speed Internet
High-
speed Internet revenue increased 9.5% and 8.3% in 2014 and 2013, respectively. Increases in the number of residential
customers receiving our high-
speed Internet services accounted for increases in revenue of 5.9% and 6.0% in 2014 and 2013,
respectively. The remaining increases in revenue in 2014 and 2013 were primarily due to higher rates from customers receiving
higher levels of service and from rate adjustments.
As of December 31, 2014, 40.2% of the homes and businesses in the areas we serve subscribed to our high-
speed Internet
services, compared to 38.4% and 36.4% as of December 31, 2013 and 2012, respectively. Our customer base continues to grow
as consumers continue to choose our high-speed Internet services and seek higher-speed offerings.
Voice
Voice revenue increased 0.4% and 2.8% in 2014 and 2013, respectively. While the growth rate of residential customer additions
slowed in 2014, the increase in the number of residential customers receiving our voice services through our discounted bundled
offerings accounted for increases in revenue of 5.1% and 6.0% in
(a)
Net additional video customers for 2012 are not available using the billable customers method and therefore net additional video customers in 2013 and 2012 are
presented using the EBU method to show an appropriate comparison.
(b)
Customer relationships represent the number of residential and business customers that subscribe to at least one of our cable services. Single product, double product
and triple product customers represent customers that subscribe to one, two or three of our cable services, respectively.
(c)
The total number of video customers as of December 31, 2013 and 2012 are also presented using the EBU method to show an appropriate comparison.
(d)
Total high-speed Internet and voice customers as of December 31, 2014 and 2013 and net additional high-
speed Internet and voice customers in 2014 are presented
using the billable customers method. Because the difference in the total number of customers and the net additional customers using the billable customers method and
the EBU method was not material, the net additional high-speed Internet and voice customers in 2013 and the December 31, 2012 metrics for high-
speed Internet and
voice customers are presented using the EBU method.
Comcast 2014 Annual Report on Form 10-K
58