Comcast 2014 Annual Report Download - page 129
Download and view the complete annual report
Please find page 129 of the 2014 Comcast annual report below. You can navigate through the pages in the report by either clicking on the pages listed below, or by using the keyword search tool below to find specific information within the annual report.-
 1
1 -
2
-
3
-
4
-
5
-
6
-
7
-
8
-
9
-
10
-
11
-
12
-
13
-
14
-
15
-
16
-
17
-
18
-
19
-
20
-
21
-
22
-
23
-
24
-
25
-
26
-
27
-
28
-
29
-
30
-
31
-
32
-
33
-
34
-
35
-
36
-
37
-
38
-
39
-
40
-
41
-
42
-
43
-
44
-
45
-
46
-
47
-
48
-
49
-
50
-
51
-
52
-
53
-
54
-
55
-
56
-
57
-
58
-
59
-
60
-
61
-
62
-
63
-
64
-
65
-
66
-
67
-
68
-
69
-
70
-
71
-
72
-
73
-
74
-
75
-
76
-
77
-
78
-
79
-
80
-
81
-
82
-
83
-
84
-
85
-
86
-
87
-
88
-
89
-
90
-
91
-
92
-
93
-
94
-
95
-
96
-
97
-
98
-
99
-
100
-
101
-
102
-
103
-
104
-
105
-
106
-
107
-
108
-
109
-
110
-
111
-
112
-
113
-
114
-
115
-
116
-
117
-
118
-
 119
119 -
 120
120 -
 121
121 -
 122
122 -
 123
123 -
 124
124 -
 125
125 -
 126
126 -
 127
127 -
 128
128 -
 129
129 -
 130
130 -
 131
131 -
 132
132 -
 133
133 -
 134
134 -
 135
135 -
 136
136 -
 137
137 -
 138
138 -
 139
139 -
140
-
141
-
142
-
143
-
144
-
145
-
146
-
147
-
148
-
149
-
150
-
151
-
152
-
153
-
154
-
155
-
156
-
157
-
158
-
159
-
160
-
161
-
162
-
163
-
164
-
165
-
166
-
167
-
168
-
169
-
170
-
171
-
172
-
173
-
174
-
175
-
176
-
177
-
178
-
179
-
180
-
181
-
182
-
183
-
184
-
185
-
186
-
187
-
188
-
189
-
190
-
191
-
192
-
193
-
194
-
195
-
196
-
197
-
198
-
199
-
200
-
201
-
202
-
203
-
204
-
205
-
206
-
207
-
208
-
209
-
210
-
211
-
212
-
213
-
214
-
215
-
216
-
217
-
218
-
219
-
220
-
221
-
222
-
223
-
224
-
225
-
226
-
227
-
228
-
229
-
230
-
231
-
232
-
233
-
234
-
235
-
236
-
237
-
238
-
239
-
240
-
241
-
242
-
243
-
244
-
245
-
246
-
247
-
248
-
249
-
250
-
251
-
252
-
253
-
254
-
255
-
256
-
257
-
258
-
259
-
260
-
261
-
262
-
263
-
264
-
265
-
266
-
267
-
268
-
269
-
270
-
271
-
272
-
273
-
274
-
275
-
276
-
277
-
278
-
279
-
280
-
281
-
282
-
283
-
284
-
285
-
286
-
287
-
288
-
289
-
290
-
291
-
292
-
293
-
294
-
295
-
296
-
297
-
298
-
299
-
300
-
301
-
302
-
303
-
304
-
305
-
306
-
307
-
308
-
309
-
310
-
311
-
312
-
313
-
314
-
315
-
316
-
317
-
318
-
319
-
320
-
321
-
322
-
323
-
324
-
325
-
326
-
327
-
328
-
329
-
330
-
331
-
332
-
333
-
334
-
335
-
336
-
337
-
338
-
339
-
340
-
341
-
342
-
343
-
344
-
345
-
346
-
347
-
348
-
349
-
350
-
351
-
352
-
353
-
354
-
355
-
356
-
357
-
358
-
359
-
360
-
361
-
362
-
363
-
364
-
365
-
366
-
367
-
368
-
369
-
370
-
371
-
372
-
373
-
374
-
375
-
376
-
377
-
378
-
379
-
380
-
381
-
382
-
383
-
384
-
385
-
386
 |
 |

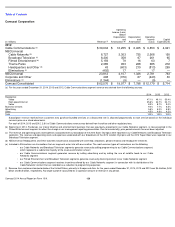
Table of Contents
Comcast Corporation
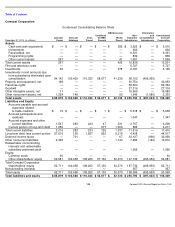
Condensed Consolidating Balance Sheet
December 31, 2013 (in millions)
Comcast
Parent
Comcast
Holdings
CCCL
Parent
Combined
CCHMO
Parents
NBCUniversal
Media
Parent
Non-
Guarantor
Subsidiaries
Elimination
and
Consolidation
Adjustments
Consolidated
Comcast
Corporation
Assets
Cash and cash equivalents
$
—
$
—
$
—
$
—
$
336
$
1,382
$
—
$
1,718
Investments
—
—
—
—
—
3,573
—
3,573
Receivables, net
—
—
—
—
—
6,376
—
6,376
Programming rights
—
—
—
—
—
928
—
928
Other current assets
237
—
—
—
35
1,208
—
1,480
Total current assets
237
—
—
—
371
13,467
—
14,075
Film and television costs
—
—
—
—
—
4,994
—
4,994
Investments
11
—
—
—
374
3,385
—
3,770
Investments in and amounts due from
subsidiaries eliminated upon
consolidation
79,956
97,429
102,673
54,724
40,644
85,164
(460,590
)
—
Property and equipment, net
220
—
—
—
—
29,620
—
29,840
Franchise rights
—
—
—
—
—
59,364
—
59,364
Goodwill
—
—
—
—
—
27,098
—
27,098
Other intangible assets, net
11
—
—
—
—
17,318
—
17,329
Other noncurrent assets, net
1,078
145
—
—
103
1,899
(882
)
2,343
Total assets
$
81,513
$
97,574
$
102,673
$
54,724
$
41,492
$
242,309
$
(461,472
)
$
158,813
Liabilities and Equity
Accounts payable and accrued
expenses related
to trade creditors
$
8
$
—
$
—
$
—
$
—
$
5,520
$
—
$
5,528
Accrued participations and residuals
—
—
—
—
—
1,239
—
1,239
Accrued expenses and other current
liabilities
1,371
266
180
47
323
6,678
—
8,865
Current portion of long
-
term debt
2,351
—
—
—
903
26
—
3,280
Total current liabilities
3,730
266
180
47
1,226
13,463
—
18,912
Long-term debt, less current portion
25,170
132
1,827
1,505
10,236
5,697
—
44,567
Deferred income taxes
—
777
—
—
59
31,840
(741
)
31,935
Other noncurrent liabilities
1,919
—
—
—
931
8,675
(141
)
11,384
Redeemable noncontrolling interests
and redeemable subsidiary preferred
stock
—
—
—
—
—
957
—
957
Equity:
Common stock
30
—
—
—
—
—
—
30
Other shareholders’ equity
50,664
96,399
100,666
53,172
29,040
181,313
(460,590
)
50,664
Total Comcast Corporation
shareholders
’
equity
50,694
96,399
100,666
53,172
29,040
181,313
(460,590
)
50,694
Noncontrolling interests
—
—
—
—
—
364
—
364
Total equity
50,694
96,399
100,666
53,172
29,040
181,677
(460,590
)
51,058
Total liabilities and equity
$
81,513
$
97,574
$
102,673
$
54,724
$
41,492
$
242,309
$
(461,472
)
$
158,813
Comcast 2014 Annual Report on Form 10
-
K
124