Comcast 2014 Annual Report Download - page 64
Download and view the complete annual report
Please find page 64 of the 2014 Comcast annual report below. You can navigate through the pages in the report by either clicking on the pages listed below, or by using the keyword search tool below to find specific information within the annual report.-
 1
1 -
2
-
3
-
4
-
5
-
6
-
7
-
8
-
9
-
10
-
11
-
12
-
13
-
14
-
15
-
16
-
17
-
18
-
19
-
20
-
21
-
22
-
23
-
24
-
25
-
26
-
27
-
28
-
29
-
30
-
31
-
32
-
33
-
34
-
35
-
36
-
37
-
38
-
39
-
40
-
41
-
42
-
43
-
44
-
45
-
46
-
47
-
48
-
49
-
50
-
51
-
52
-
53
-
 54
54 -
 55
55 -
 56
56 -
 57
57 -
 58
58 -
 59
59 -
 60
60 -
 61
61 -
 62
62 -
 63
63 -
 64
64 -
 65
65 -
 66
66 -
 67
67 -
 68
68 -
 69
69 -
 70
70 -
 71
71 -
 72
72 -
 73
73 -
 74
74 -
75
-
76
-
77
-
78
-
79
-
80
-
81
-
82
-
83
-
84
-
85
-
86
-
87
-
88
-
89
-
90
-
91
-
92
-
93
-
94
-
95
-
96
-
97
-
98
-
99
-
100
-
101
-
102
-
103
-
104
-
105
-
106
-
107
-
108
-
109
-
110
-
111
-
112
-
113
-
114
-
115
-
116
-
117
-
118
-
119
-
120
-
121
-
122
-
123
-
124
-
125
-
126
-
127
-
128
-
129
-
130
-
131
-
132
-
133
-
134
-
135
-
136
-
137
-
138
-
139
-
140
-
141
-
142
-
143
-
144
-
145
-
146
-
147
-
148
-
149
-
150
-
151
-
152
-
153
-
154
-
155
-
156
-
157
-
158
-
159
-
160
-
161
-
162
-
163
-
164
-
165
-
166
-
167
-
168
-
169
-
170
-
171
-
172
-
173
-
174
-
175
-
176
-
177
-
178
-
179
-
180
-
181
-
182
-
183
-
184
-
185
-
186
-
187
-
188
-
189
-
190
-
191
-
192
-
193
-
194
-
195
-
196
-
197
-
198
-
199
-
200
-
201
-
202
-
203
-
204
-
205
-
206
-
207
-
208
-
209
-
210
-
211
-
212
-
213
-
214
-
215
-
216
-
217
-
218
-
219
-
220
-
221
-
222
-
223
-
224
-
225
-
226
-
227
-
228
-
229
-
230
-
231
-
232
-
233
-
234
-
235
-
236
-
237
-
238
-
239
-
240
-
241
-
242
-
243
-
244
-
245
-
246
-
247
-
248
-
249
-
250
-
251
-
252
-
253
-
254
-
255
-
256
-
257
-
258
-
259
-
260
-
261
-
262
-
263
-
264
-
265
-
266
-
267
-
268
-
269
-
270
-
271
-
272
-
273
-
274
-
275
-
276
-
277
-
278
-
279
-
280
-
281
-
282
-
283
-
284
-
285
-
286
-
287
-
288
-
289
-
290
-
291
-
292
-
293
-
294
-
295
-
296
-
297
-
298
-
299
-
300
-
301
-
302
-
303
-
304
-
305
-
306
-
307
-
308
-
309
-
310
-
311
-
312
-
313
-
314
-
315
-
316
-
317
-
318
-
319
-
320
-
321
-
322
-
323
-
324
-
325
-
326
-
327
-
328
-
329
-
330
-
331
-
332
-
333
-
334
-
335
-
336
-
337
-
338
-
339
-
340
-
341
-
342
-
343
-
344
-
345
-
346
-
347
-
348
-
349
-
350
-
351
-
352
-
353
-
354
-
355
-
356
-
357
-
358
-
359
-
360
-
361
-
362
-
363
-
364
-
365
-
366
-
367
-
368
-
369
-
370
-
371
-
372
-
373
-
374
-
375
-
376
-
377
-
378
-
379
-
380
-
381
-
382
-
383
-
384
-
385
-
386
 |
 |

Table of Contents
2014 and 2013, respectively. The increases in revenue were partially offset in both years by the impact of the allocation of voice
revenue for our bundled customers. The amounts allocated to voice revenue in the bundled rate decreased in 2014 and 2013
because video and high-speed Internet rates increased, while voice rates remained relatively flat.
As of December 31, 2014, 20.5% of the homes and businesses in the areas we serve subscribed to our voice services, compared
to 19.9% and 18.7% as of December 31, 2013 and 2012, respectively.
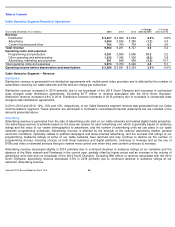
Business Services
Business services revenue increased 21.9% and 26.4% in 2014 and 2013, respectively. The increases in 2014 and 2013 were
primarily due to a higher number of small business customers receiving our high-
speed Internet and voice services. The remaining
increases in both years were primarily due to continued growth in the number of customers receiving our Ethernet network and
cellular backhaul services.
In 2014, our medium-
sized business customers represented 22% of total business services revenue, compared to 19% and 15% in
2013 and 2012, respectively.
We believe the increases in the number of business customers are primarily the result of our efforts to gain market share from
competitors by offering competitive services and pricing.
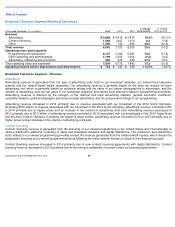
Advertising
As part of our distribution agreements with cable networks, we generally receive an allocation of scheduled advertising time on
cable networks that our Spotlight business sells to local, regional and national advertisers. In most cases, the available advertising
units are sold by our sales force. In some cases, we work with representation firms as an extension of our sales force to sell a
portion of the advertising time allocated to us. We also represent the advertising sales efforts of other multichannel video providers
in some markets. In addition, we generate revenue from the sale of advertising online and on our On Demand service. Advertising
revenue is affected by the strength of the advertising market and general economic conditions.
Advertising revenue increased 11.5% in 2014 primarily due to an increase in political advertising revenue of 8.0%, as well as an
increase in revenue in our national and local advertising markets. Excluding the impact of political advertising revenue, advertising
revenue increased 3.5% in 2014. Advertising revenue decreased 4.2% in 2013 primarily due to lower political advertising revenue.
Excluding the impact of political advertising revenue, advertising revenue increased 4.8% in 2013 primarily due to increases in our
national and regional advertising markets.
Other
We receive revenue related to cable franchise and other regulatory fees. We also receive revenue related to our digital media
center, commissions from electronic retailing networks, and fees from other services, such as our home security and automation
services. Cable franchise and other regulatory fees represent the fees we are required to pay to federal, state and local authorities
that we pass through to our customers. Under the terms of our cable franchise agreements, we are generally required to pay to the
cable franchising authority an amount based on our gross video revenue. The changes in franchise and other regulatory fees
collected from our cable services customers are generally due to changes in the revenue on which the fees apply.
Other revenue increased 4.9% and 10.5% in 2014 and 2013, respectively, primarily due to increases in revenue from our home
security and automation services, as well as increases in cable franchise and other regulatory fees.
59
Comcast 2014 Annual Report on Form 10
-
K