Comcast 2014 Annual Report Download - page 132
Download and view the complete annual report
Please find page 132 of the 2014 Comcast annual report below. You can navigate through the pages in the report by either clicking on the pages listed below, or by using the keyword search tool below to find specific information within the annual report.-
 1
1 -
2
-
3
-
4
-
5
-
6
-
7
-
8
-
9
-
10
-
11
-
12
-
13
-
14
-
15
-
16
-
17
-
18
-
19
-
20
-
21
-
22
-
23
-
24
-
25
-
26
-
27
-
28
-
29
-
30
-
31
-
32
-
33
-
34
-
35
-
36
-
37
-
38
-
39
-
40
-
41
-
42
-
43
-
44
-
45
-
46
-
47
-
48
-
49
-
50
-
51
-
52
-
53
-
54
-
55
-
56
-
57
-
58
-
59
-
60
-
61
-
62
-
63
-
64
-
65
-
66
-
67
-
68
-
69
-
70
-
71
-
72
-
73
-
74
-
75
-
76
-
77
-
78
-
79
-
80
-
81
-
82
-
83
-
84
-
85
-
86
-
87
-
88
-
89
-
90
-
91
-
92
-
93
-
94
-
95
-
96
-
97
-
98
-
99
-
100
-
101
-
102
-
103
-
104
-
105
-
106
-
107
-
108
-
109
-
110
-
111
-
112
-
113
-
114
-
115
-
116
-
117
-
118
-
119
-
120
-
121
-
 122
122 -
 123
123 -
 124
124 -
 125
125 -
 126
126 -
 127
127 -
 128
128 -
 129
129 -
 130
130 -
 131
131 -
 132
132 -
 133
133 -
 134
134 -
 135
135 -
 136
136 -
 137
137 -
 138
138 -
 139
139 -
 140
140 -
 141
141 -
 142
142 -
143
-
144
-
145
-
146
-
147
-
148
-
149
-
150
-
151
-
152
-
153
-
154
-
155
-
156
-
157
-
158
-
159
-
160
-
161
-
162
-
163
-
164
-
165
-
166
-
167
-
168
-
169
-
170
-
171
-
172
-
173
-
174
-
175
-
176
-
177
-
178
-
179
-
180
-
181
-
182
-
183
-
184
-
185
-
186
-
187
-
188
-
189
-
190
-
191
-
192
-
193
-
194
-
195
-
196
-
197
-
198
-
199
-
200
-
201
-
202
-
203
-
204
-
205
-
206
-
207
-
208
-
209
-
210
-
211
-
212
-
213
-
214
-
215
-
216
-
217
-
218
-
219
-
220
-
221
-
222
-
223
-
224
-
225
-
226
-
227
-
228
-
229
-
230
-
231
-
232
-
233
-
234
-
235
-
236
-
237
-
238
-
239
-
240
-
241
-
242
-
243
-
244
-
245
-
246
-
247
-
248
-
249
-
250
-
251
-
252
-
253
-
254
-
255
-
256
-
257
-
258
-
259
-
260
-
261
-
262
-
263
-
264
-
265
-
266
-
267
-
268
-
269
-
270
-
271
-
272
-
273
-
274
-
275
-
276
-
277
-
278
-
279
-
280
-
281
-
282
-
283
-
284
-
285
-
286
-
287
-
288
-
289
-
290
-
291
-
292
-
293
-
294
-
295
-
296
-
297
-
298
-
299
-
300
-
301
-
302
-
303
-
304
-
305
-
306
-
307
-
308
-
309
-
310
-
311
-
312
-
313
-
314
-
315
-
316
-
317
-
318
-
319
-
320
-
321
-
322
-
323
-
324
-
325
-
326
-
327
-
328
-
329
-
330
-
331
-
332
-
333
-
334
-
335
-
336
-
337
-
338
-
339
-
340
-
341
-
342
-
343
-
344
-
345
-
346
-
347
-
348
-
349
-
350
-
351
-
352
-
353
-
354
-
355
-
356
-
357
-
358
-
359
-
360
-
361
-
362
-
363
-
364
-
365
-
366
-
367
-
368
-
369
-
370
-
371
-
372
-
373
-
374
-
375
-
376
-
377
-
378
-
379
-
380
-
381
-
382
-
383
-
384
-
385
-
386
 |
 |

Table of Contents
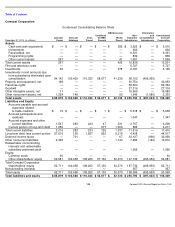
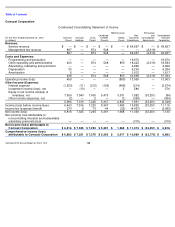
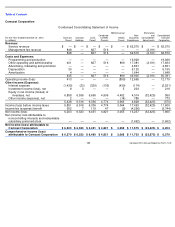
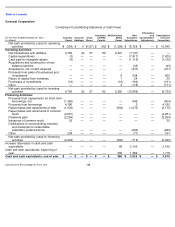
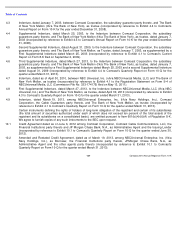
Comcast Corporation
Condensed Consolidating Statement of Income
For the Year Ended December 31, 2012
(in millions)
Comcast
Parent
Comcast
Holdings
CCCL
Parent
Combined
CCHMO
Parents
NBCUniversal
Media
Parent
Non-
Guarantor
Subsidiaries
Elimination
and
Consolidation
Adjustments
Consolidated
Comcast
Corporation
Revenue:
Service revenue
$
—
$
—
$
—
$
—
$
—
$
62,570
$
—
$
62,570
Management fee revenue
848
—
827
516
—
—
(
2,191
)
—
848
—
827
516
—
62,570
(2,191
)
62,570
Costs and Expenses:
Programming and production
—
—
—
—
—
19,929
—
19,929
Other operating and administrative
401
—
827
516
899
17,381
(2,191
)
17,833
Advertising, marketing and promotion
—
—
—
—
—
4,831
—
4,831
Depreciation
30
—
—
—
—
6,120
—
6,150
Amortization
4
—
—
—
—
1,644
—
1,648
435
—
827
516
899
49,905
(2,191
)
50,391
Operating income (loss)
413
—
—
—
(
899
)
12,665
—
12,179
Other Income (Expense):
Interest expense
(1,430
)
(23
)
(329
)
(135
)
(430
)
(174
)
—
(
2,521
)
Investment income (loss), net
8
3
—
—
5
203
—
219
Equity in net income (losses) of
investees, net
6,858
6,536
6,665
4,909
4,402
4,014
(32,425
)
959
Other income (expense), net
2
—
—
—
(
14
)
785
—
773
5,438
6,516
6,336
4,774
3,963
4,828
(32,425
)
(570
)
Income (loss) before income taxes
5,851
6,516
6,336
4,774
3,064
17,493
(32,425
)
11,609
Income tax (expense) benefit
352
7
115
47
(9
)
(4,256
)
—
(
3,744
)
Net income (loss)
6,203
6,523
6,451
4,821
3,055
13,237
(32,425
)
7,865
Net (income) loss attributable to
noncontrolling interests and redeemable
subsidiary preferred stock
—
—
—
—
—
(
1,662
)
—
(
1,662
)
Net income (loss) attributable to
Comcast Corporation
$
6,203
$
6,523
$
6,451
$
4,821
$
3,055
$
11,575
$
(32,425
)
$
6,203
Comprehensive income (loss)
attributable to Comcast Corporation
$
6,370
$
6,523
$
6,460
$
4,821
$
3,068
$
11,703
$
(32,575
)
$
6,370
127
Comcast 2014 Annual Report on Form 10
-
K